Attention: : Confluence is not suitable for the storage of highly confidential data. Please ensure that any data classified as Highly Protected is stored using a more secure platform.
If you have any questions, please refer to the University's data classification guide or contact ict.askcyber@sydney.edu.au
Image Gallery
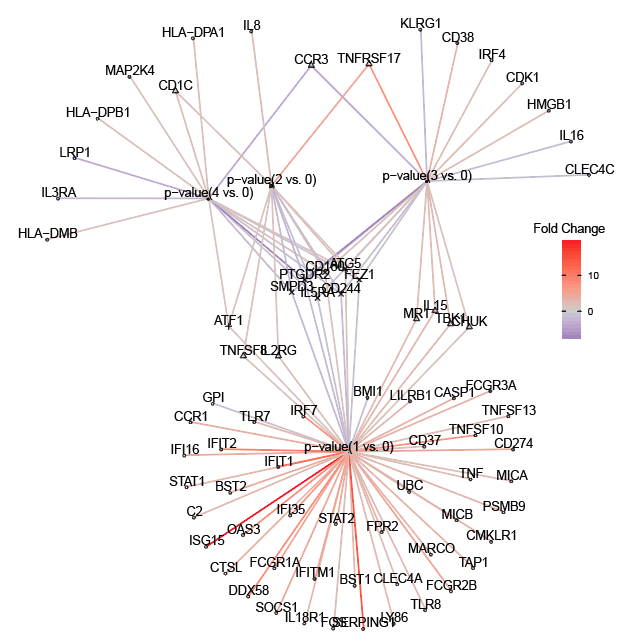
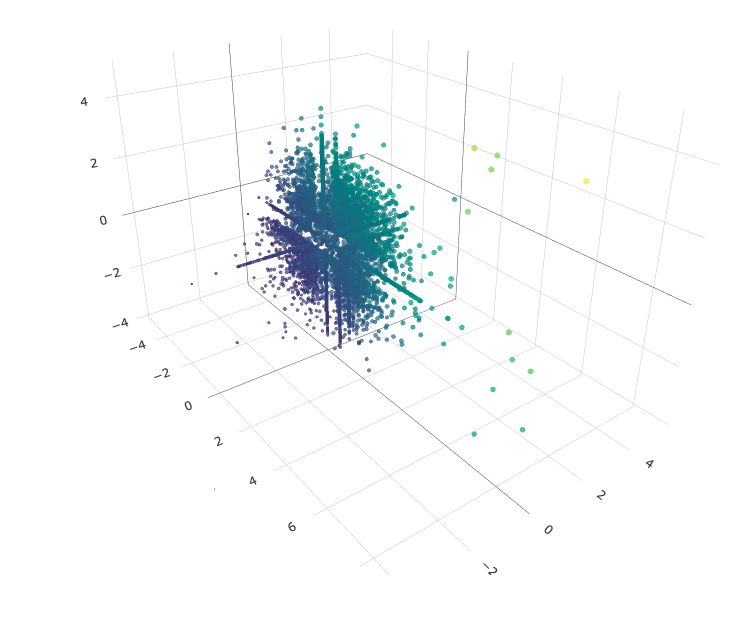
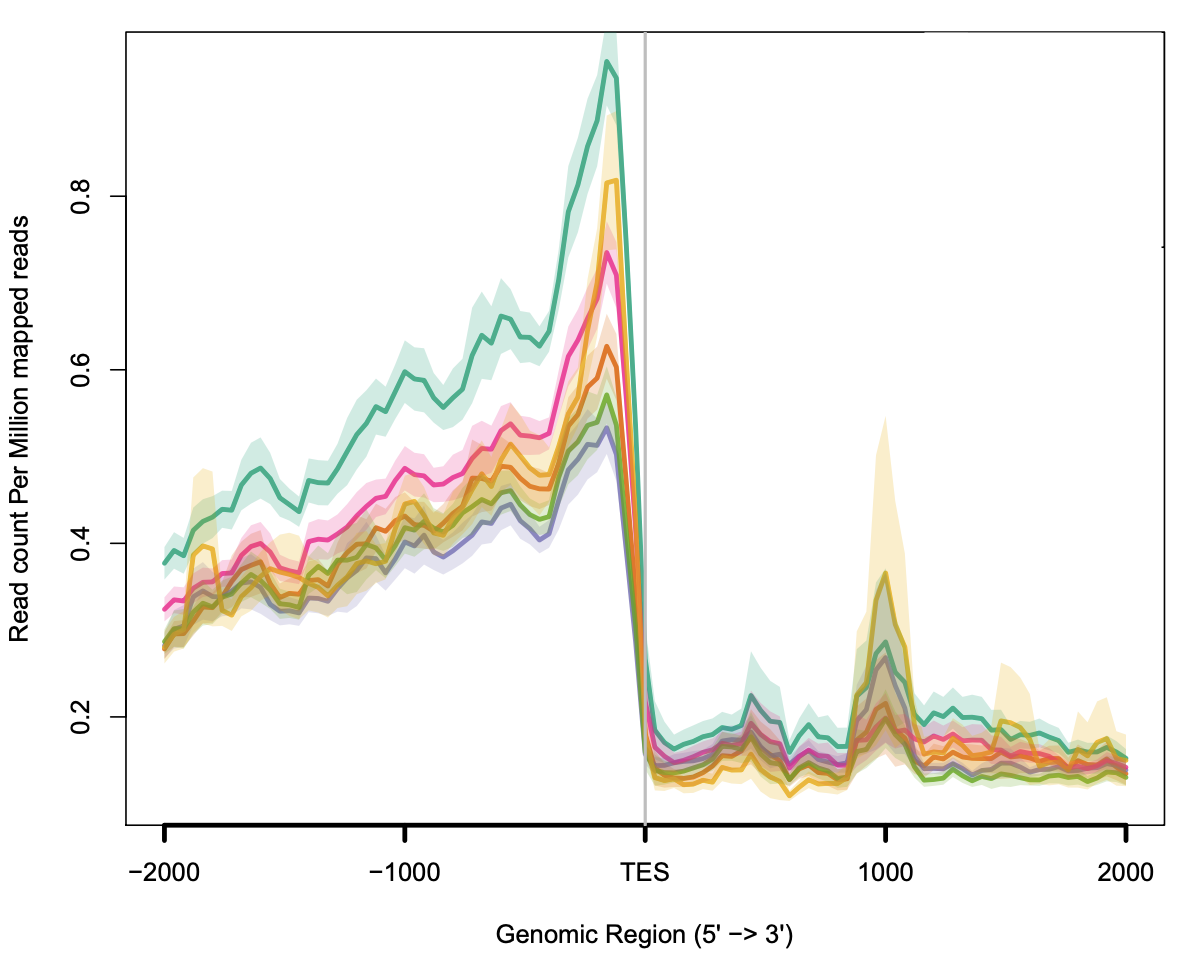
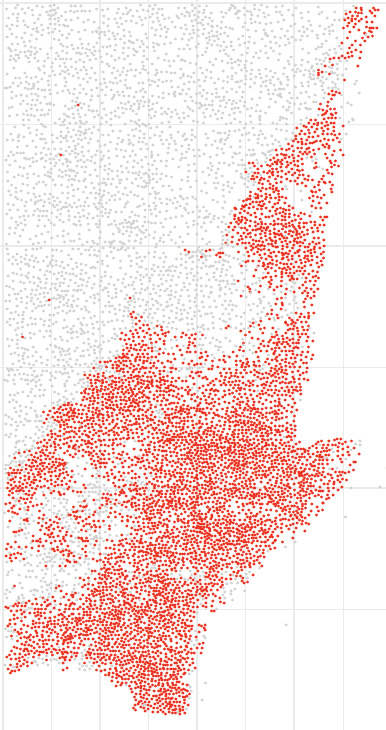
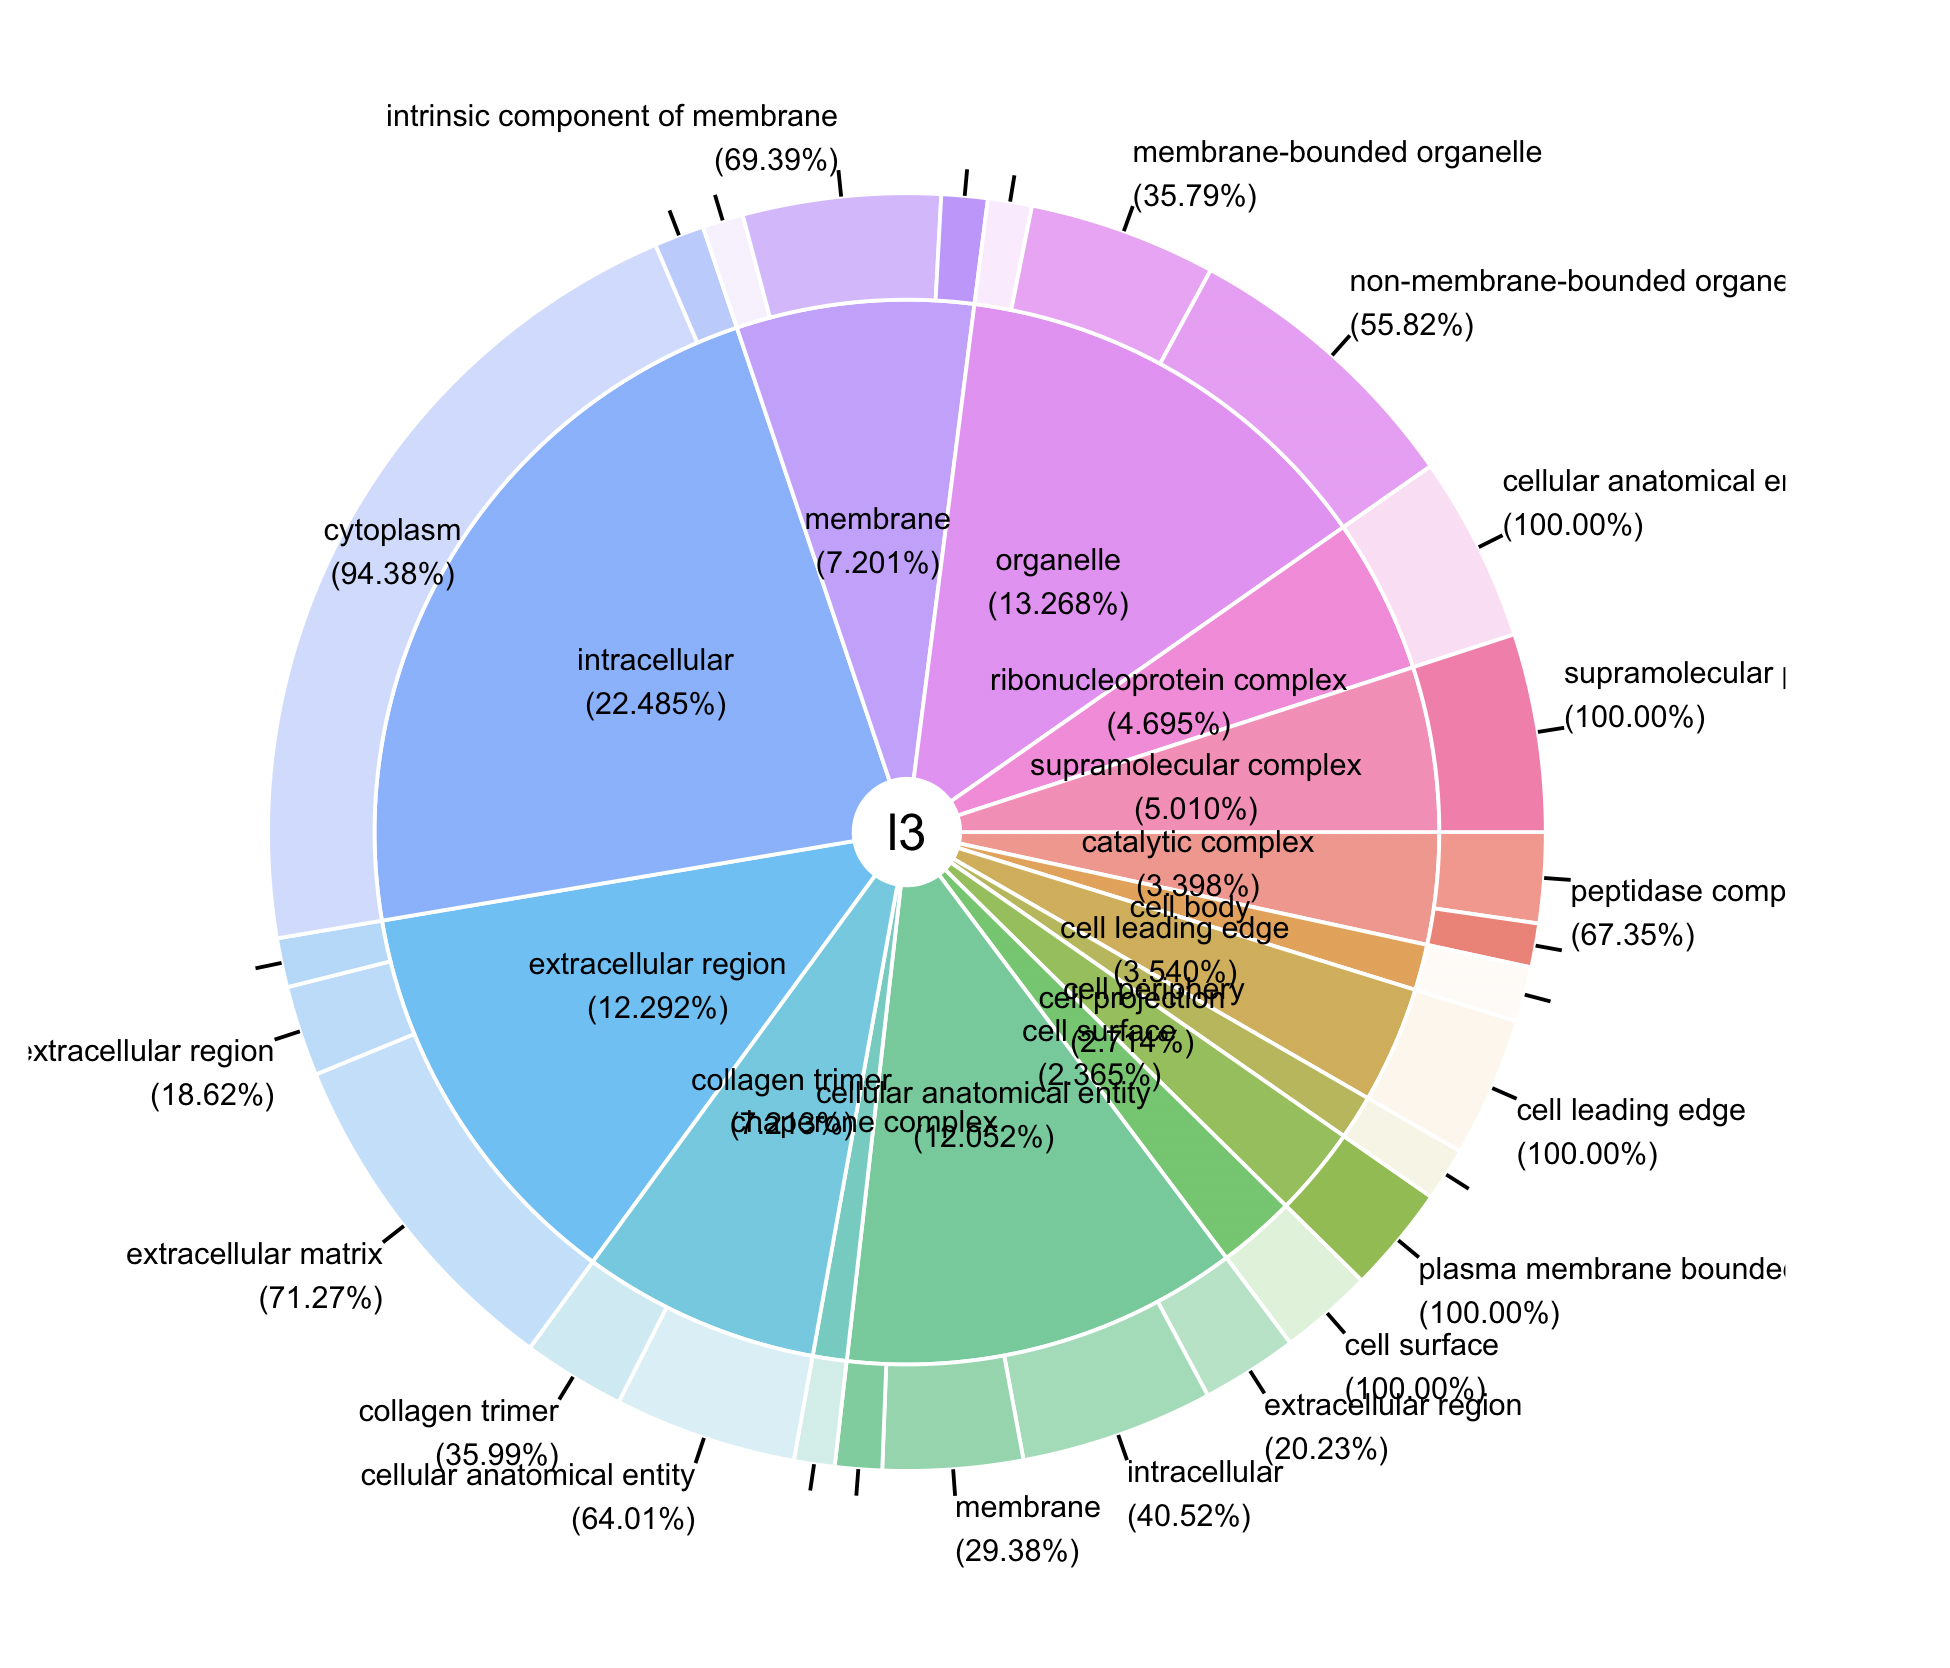
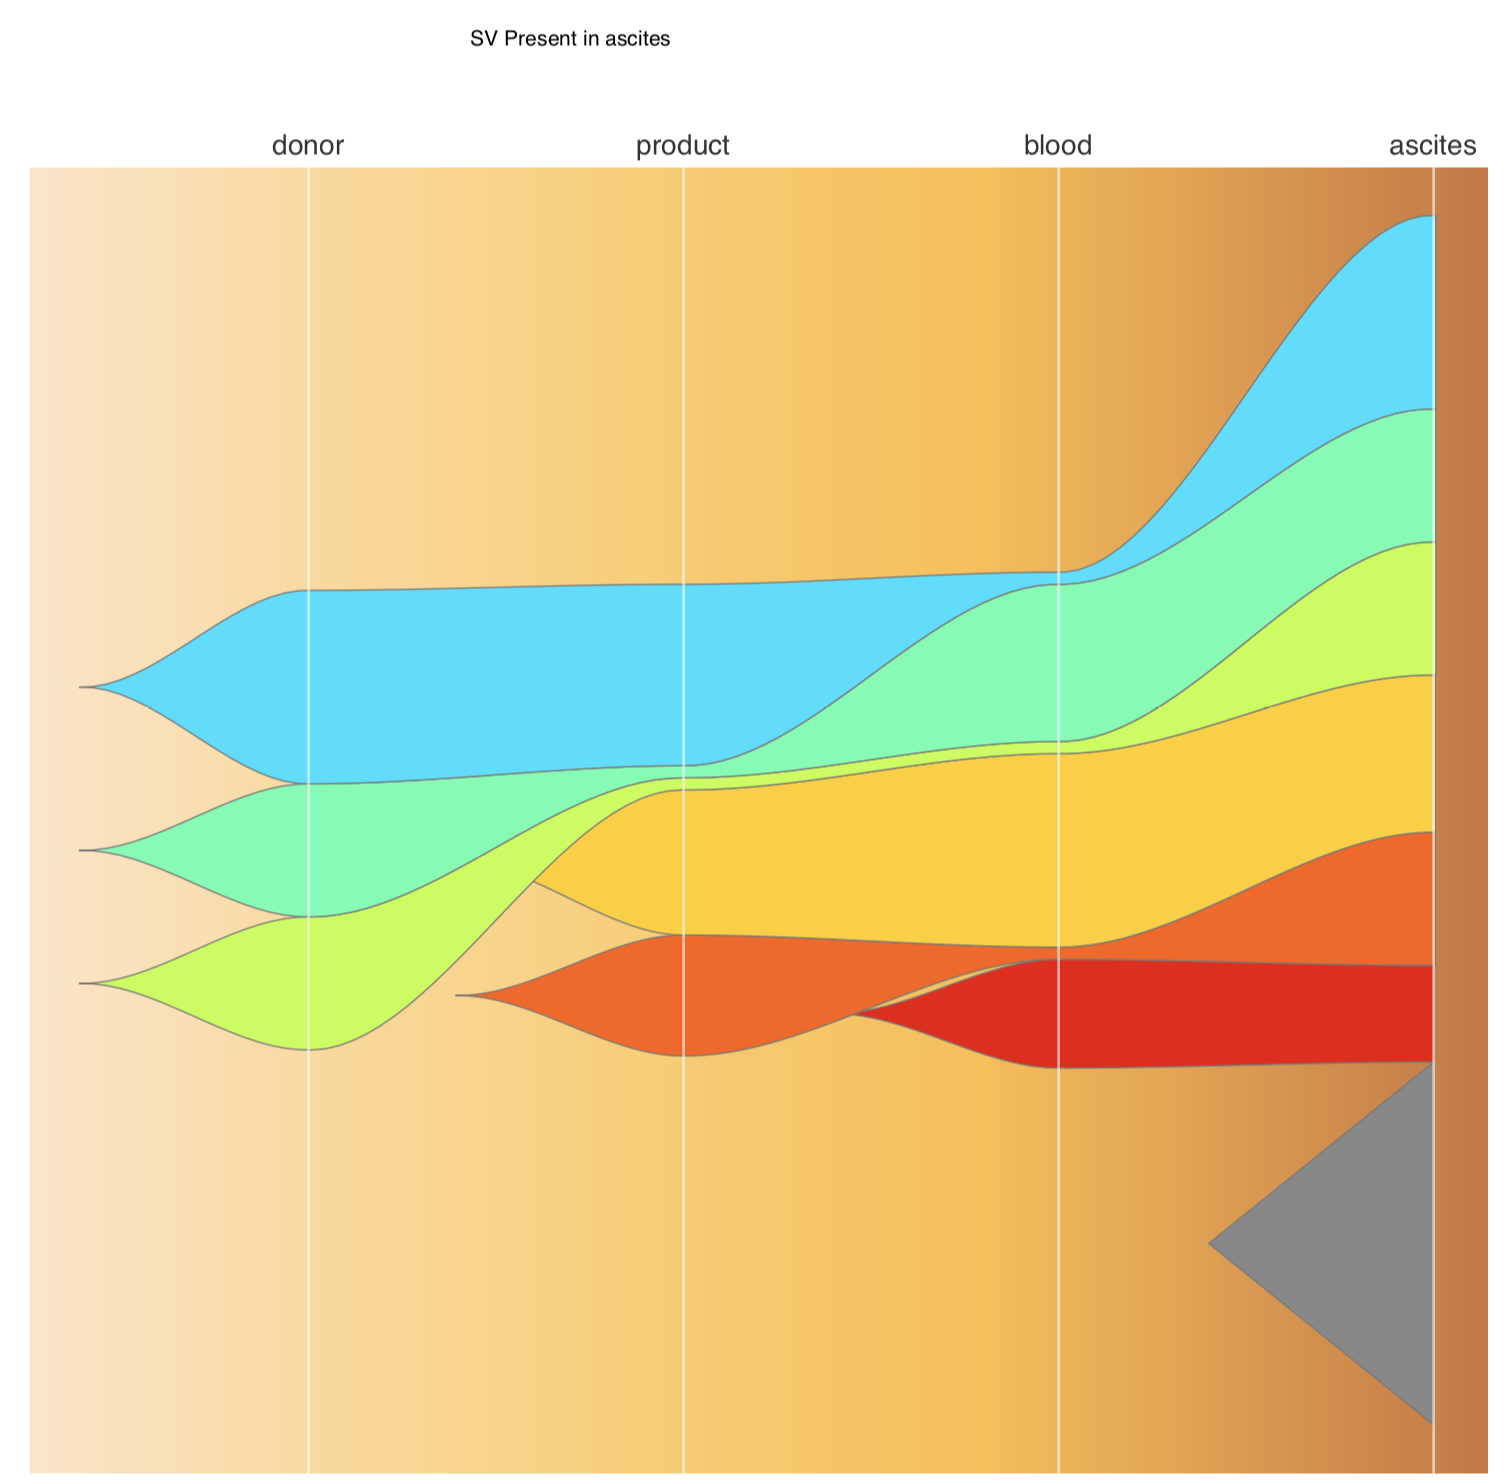
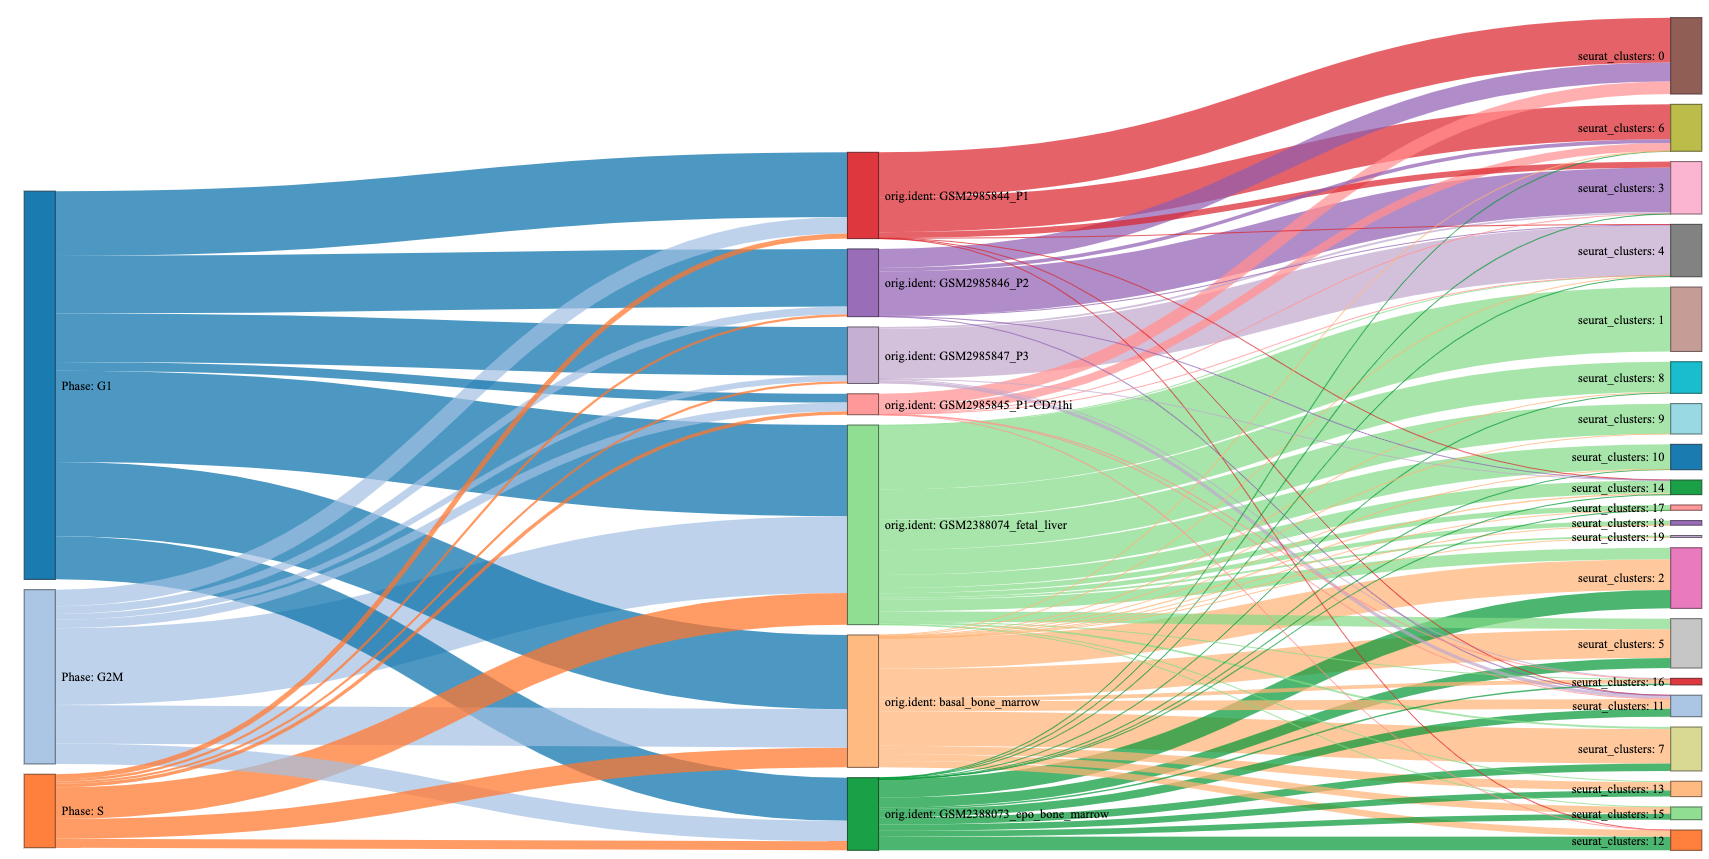
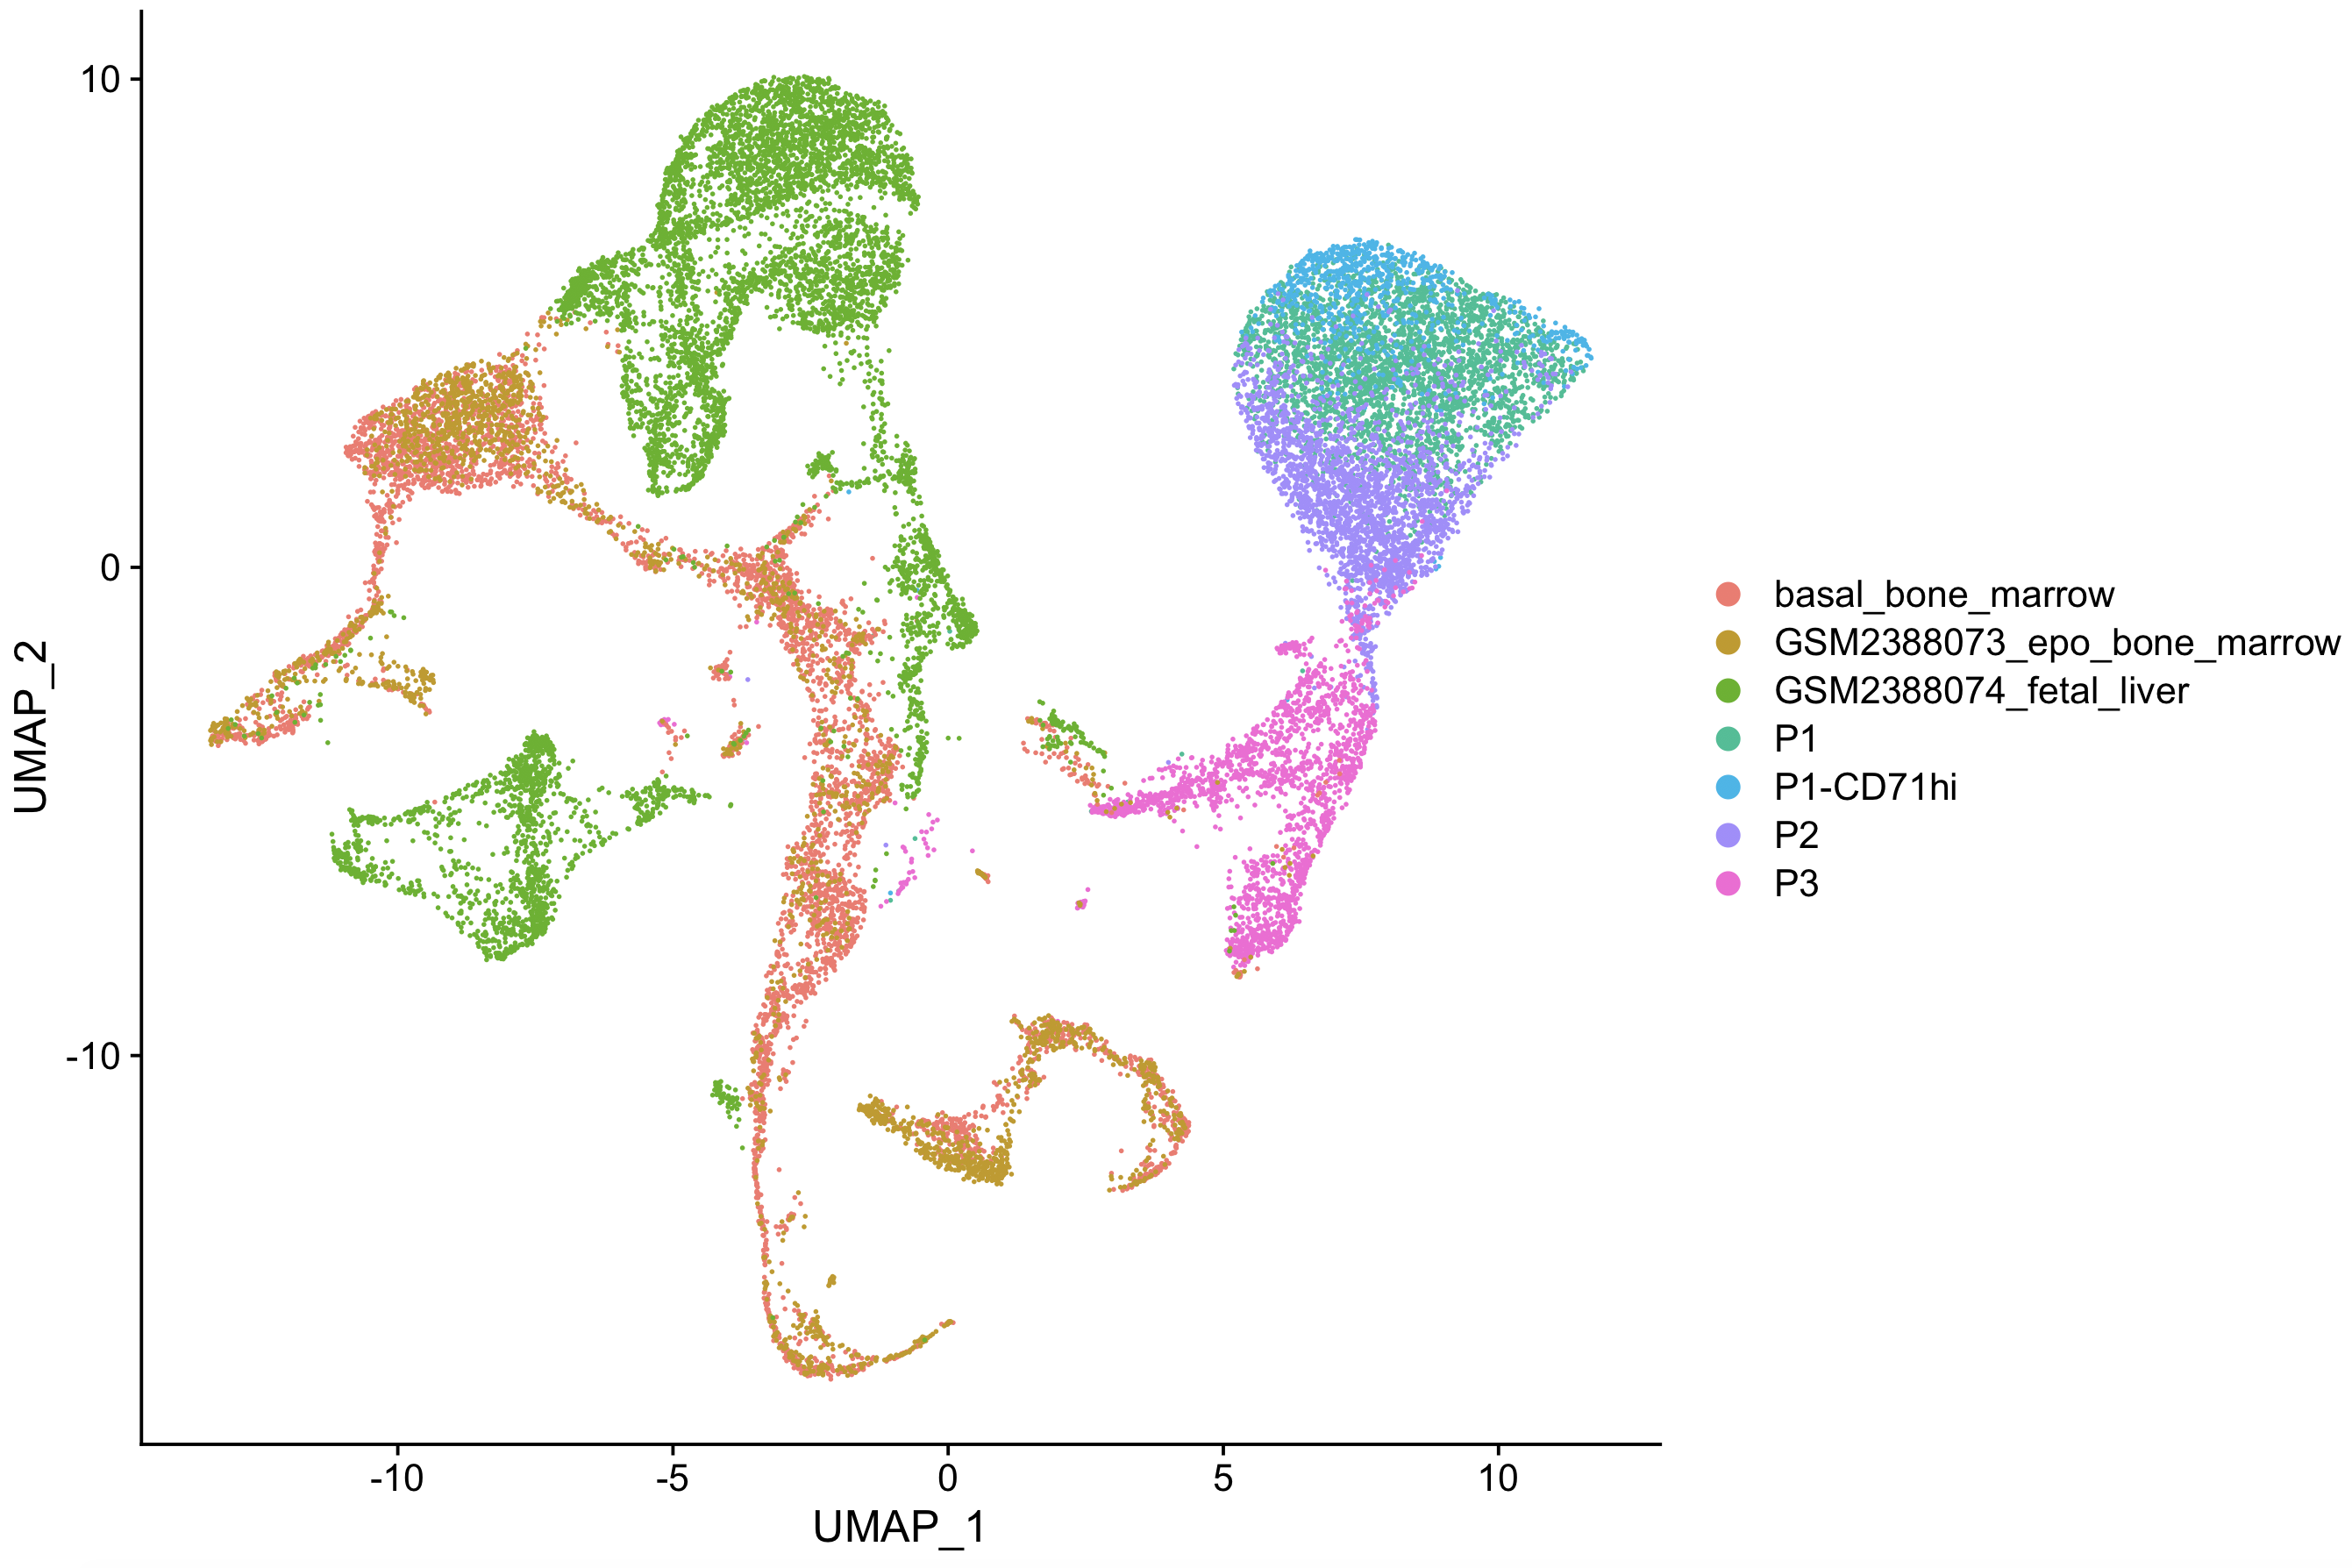
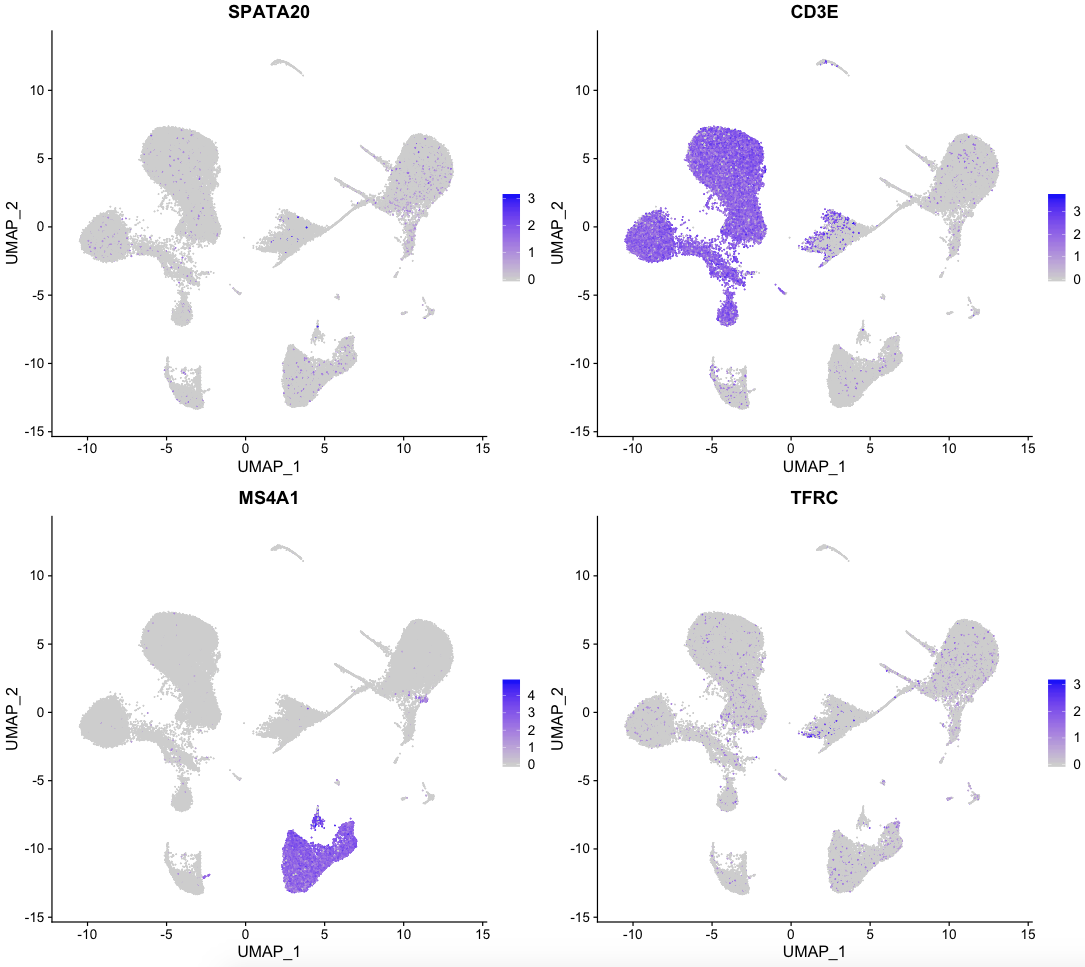
This is where the bioinformatics service puts some of the images generated with hub researchers. Data visualisation can make a huge difference in how the data can be interpreted and there are a lot of options available to researchers. If you see something you want to try or have an idea, please contact us and we can work together to bring your vision to reality.
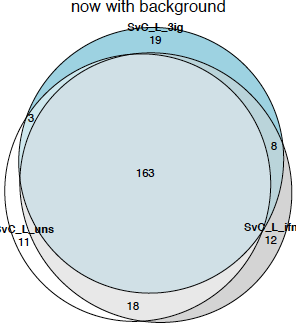
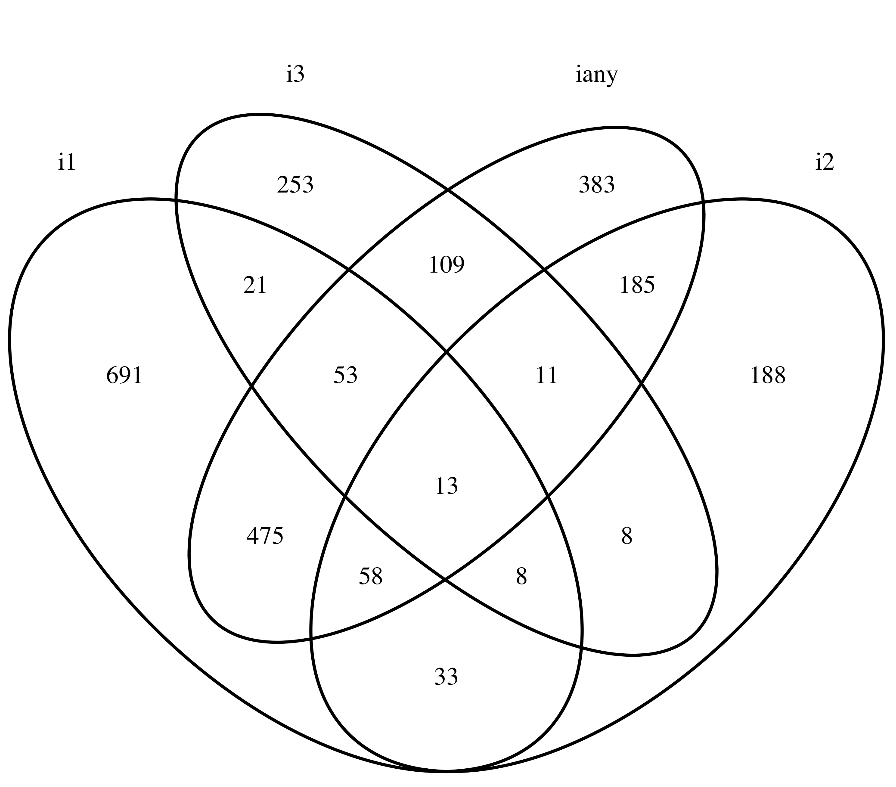
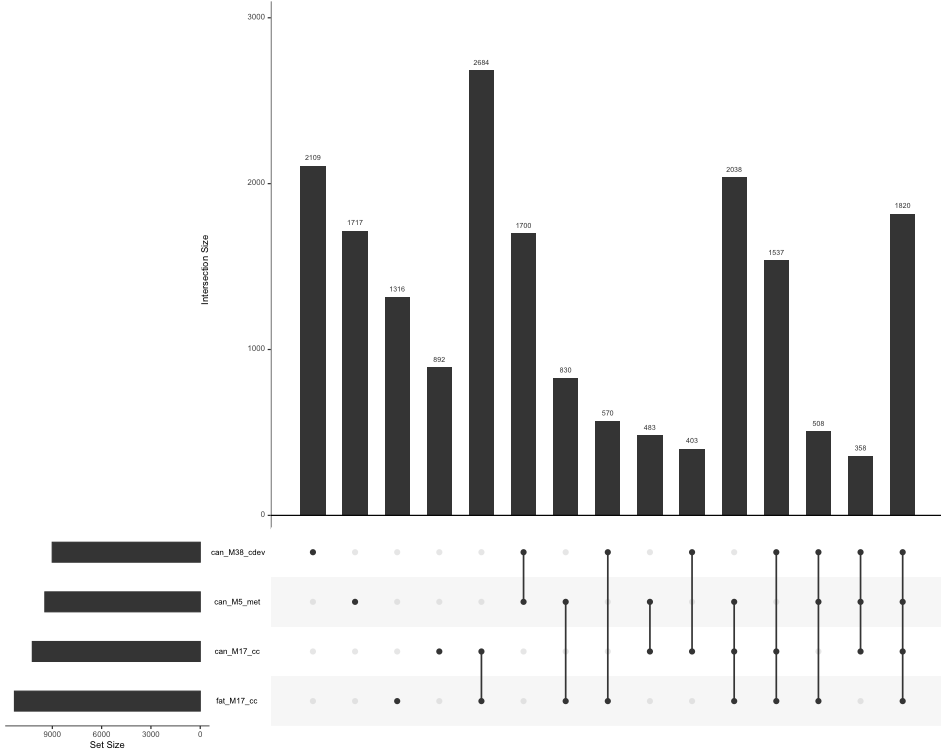
We have recently been working with researchers to understand the data underlying venn diagrams in more detail. Here are some refinements, extensions and alternatives we have been working on (please note, they are from different data)
Spotlight |
|||
|---|---|---|---|
|
|
|
|
|
|
|
|
|
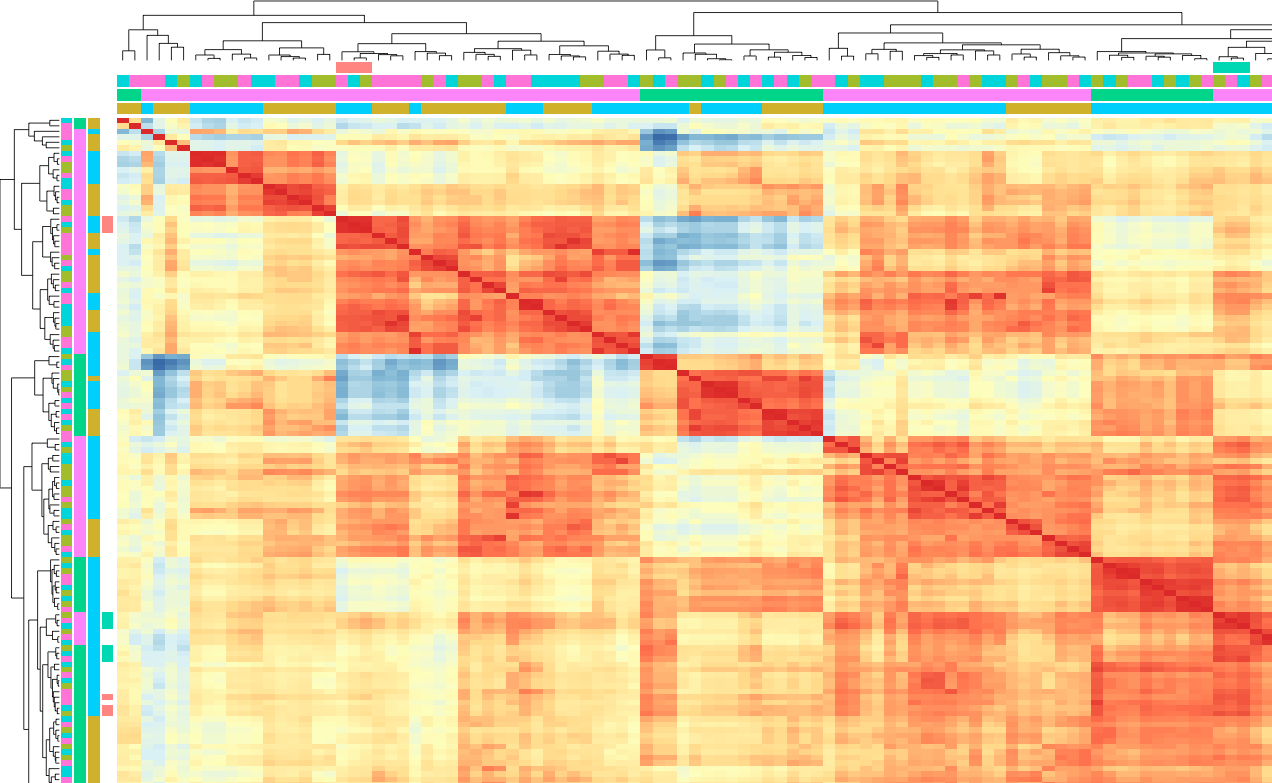
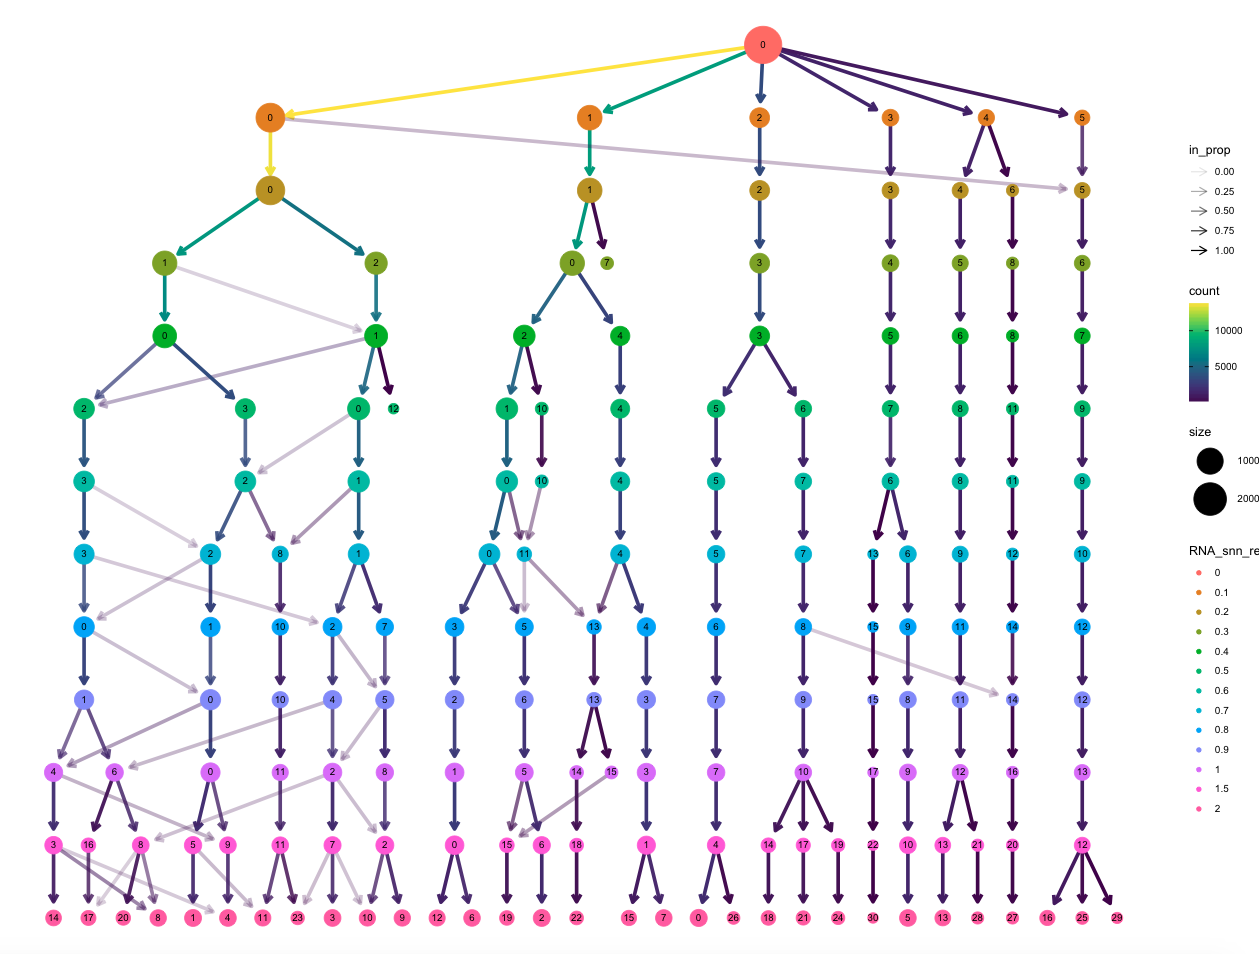
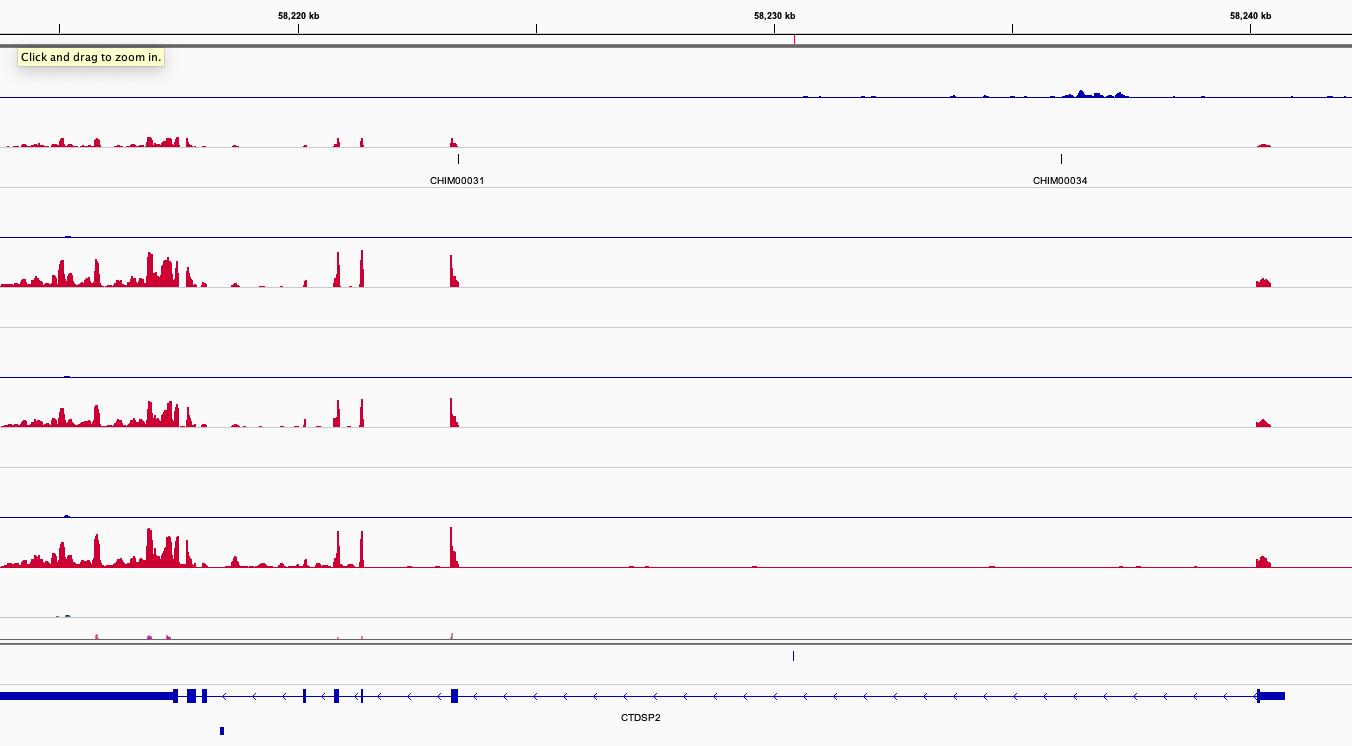
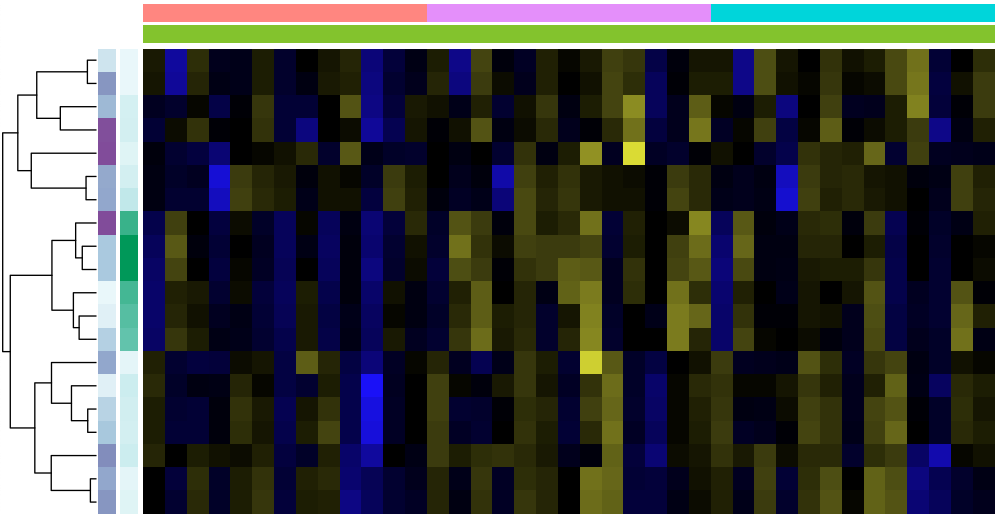
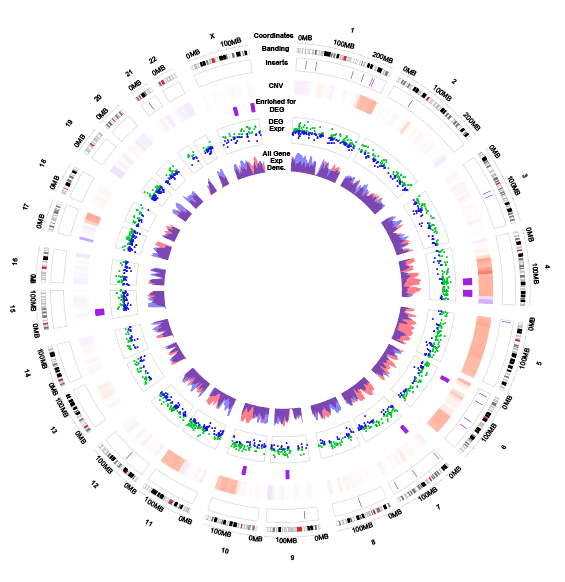
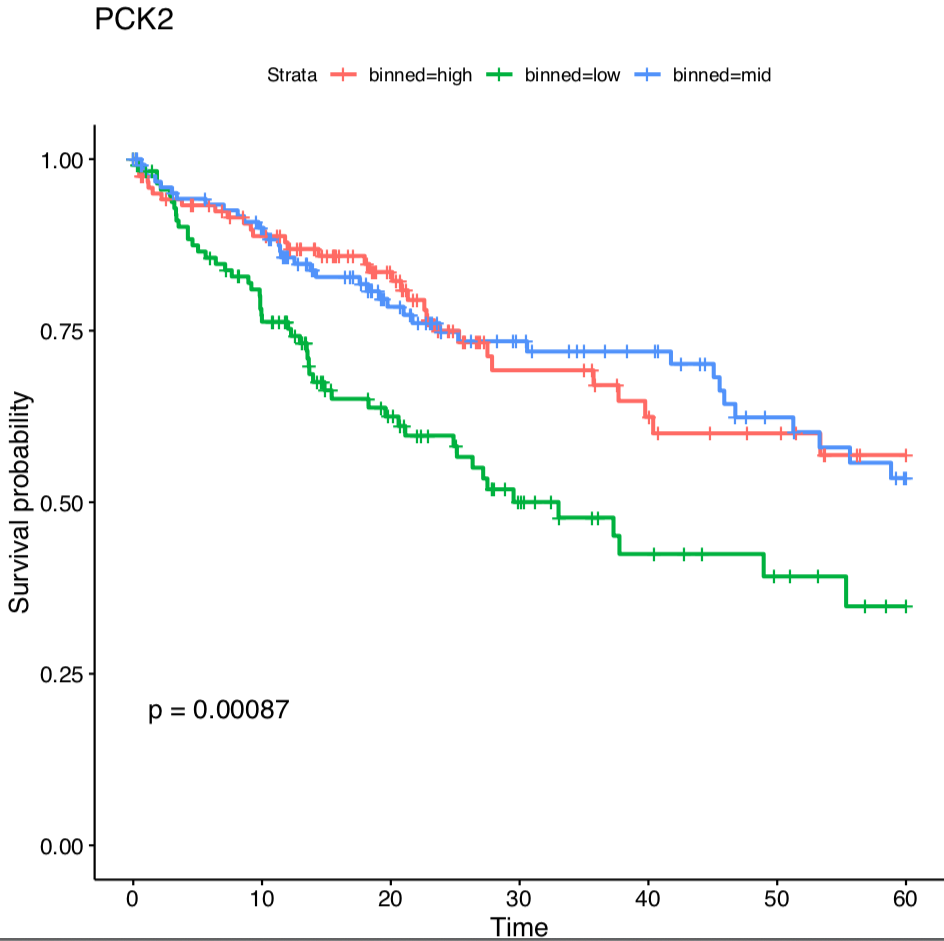
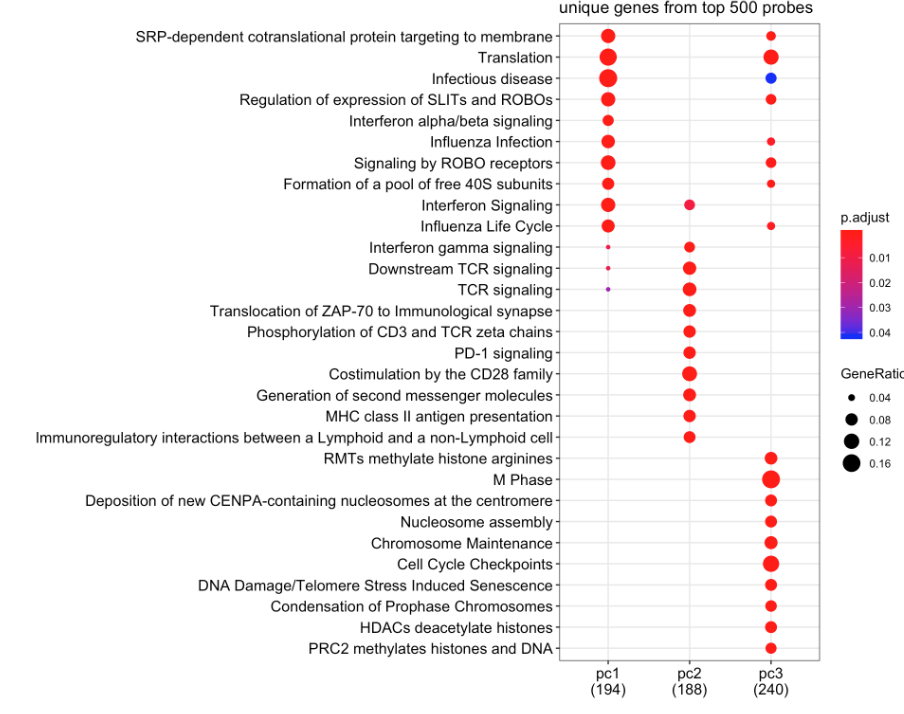
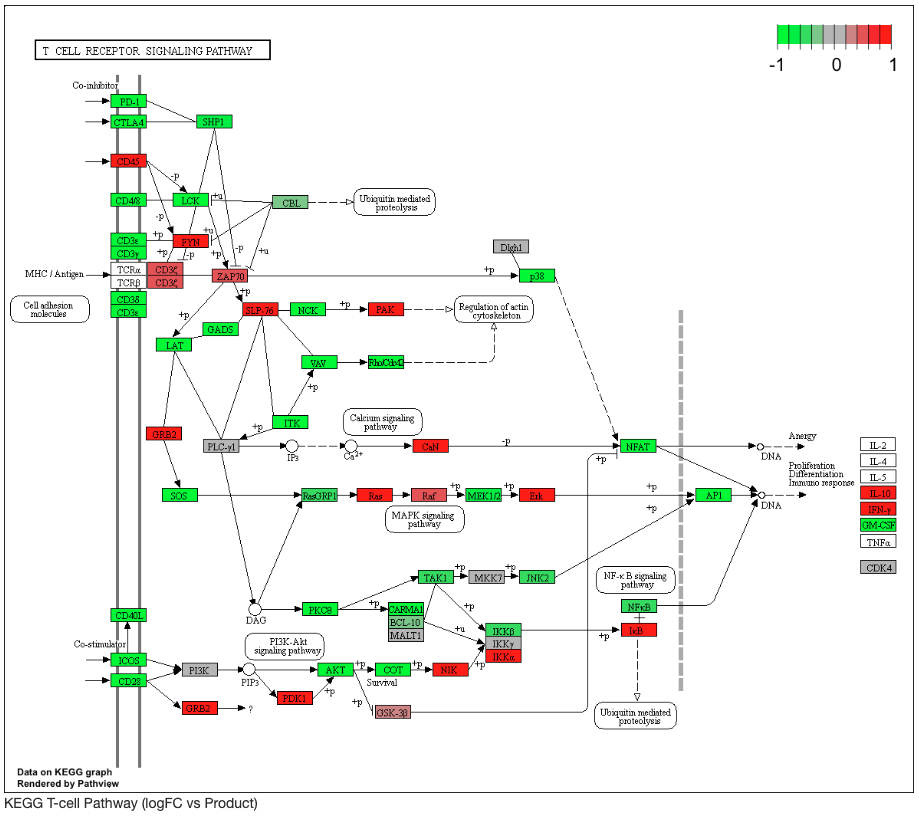
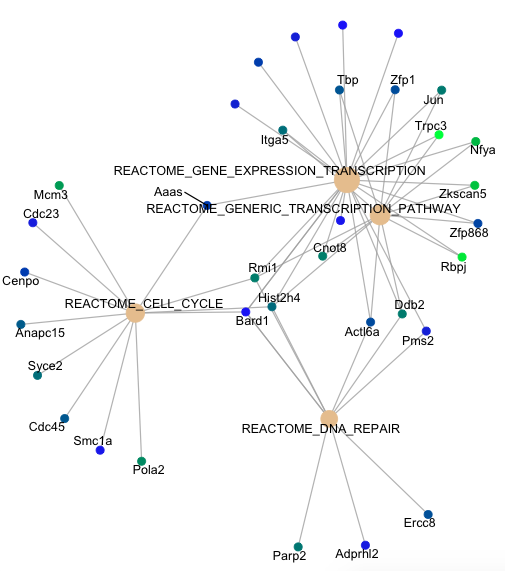
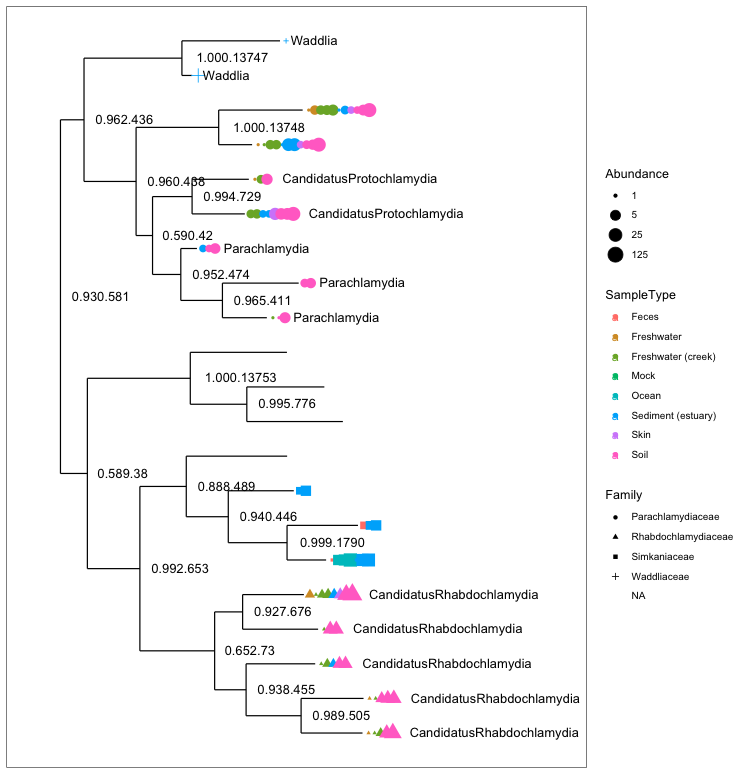
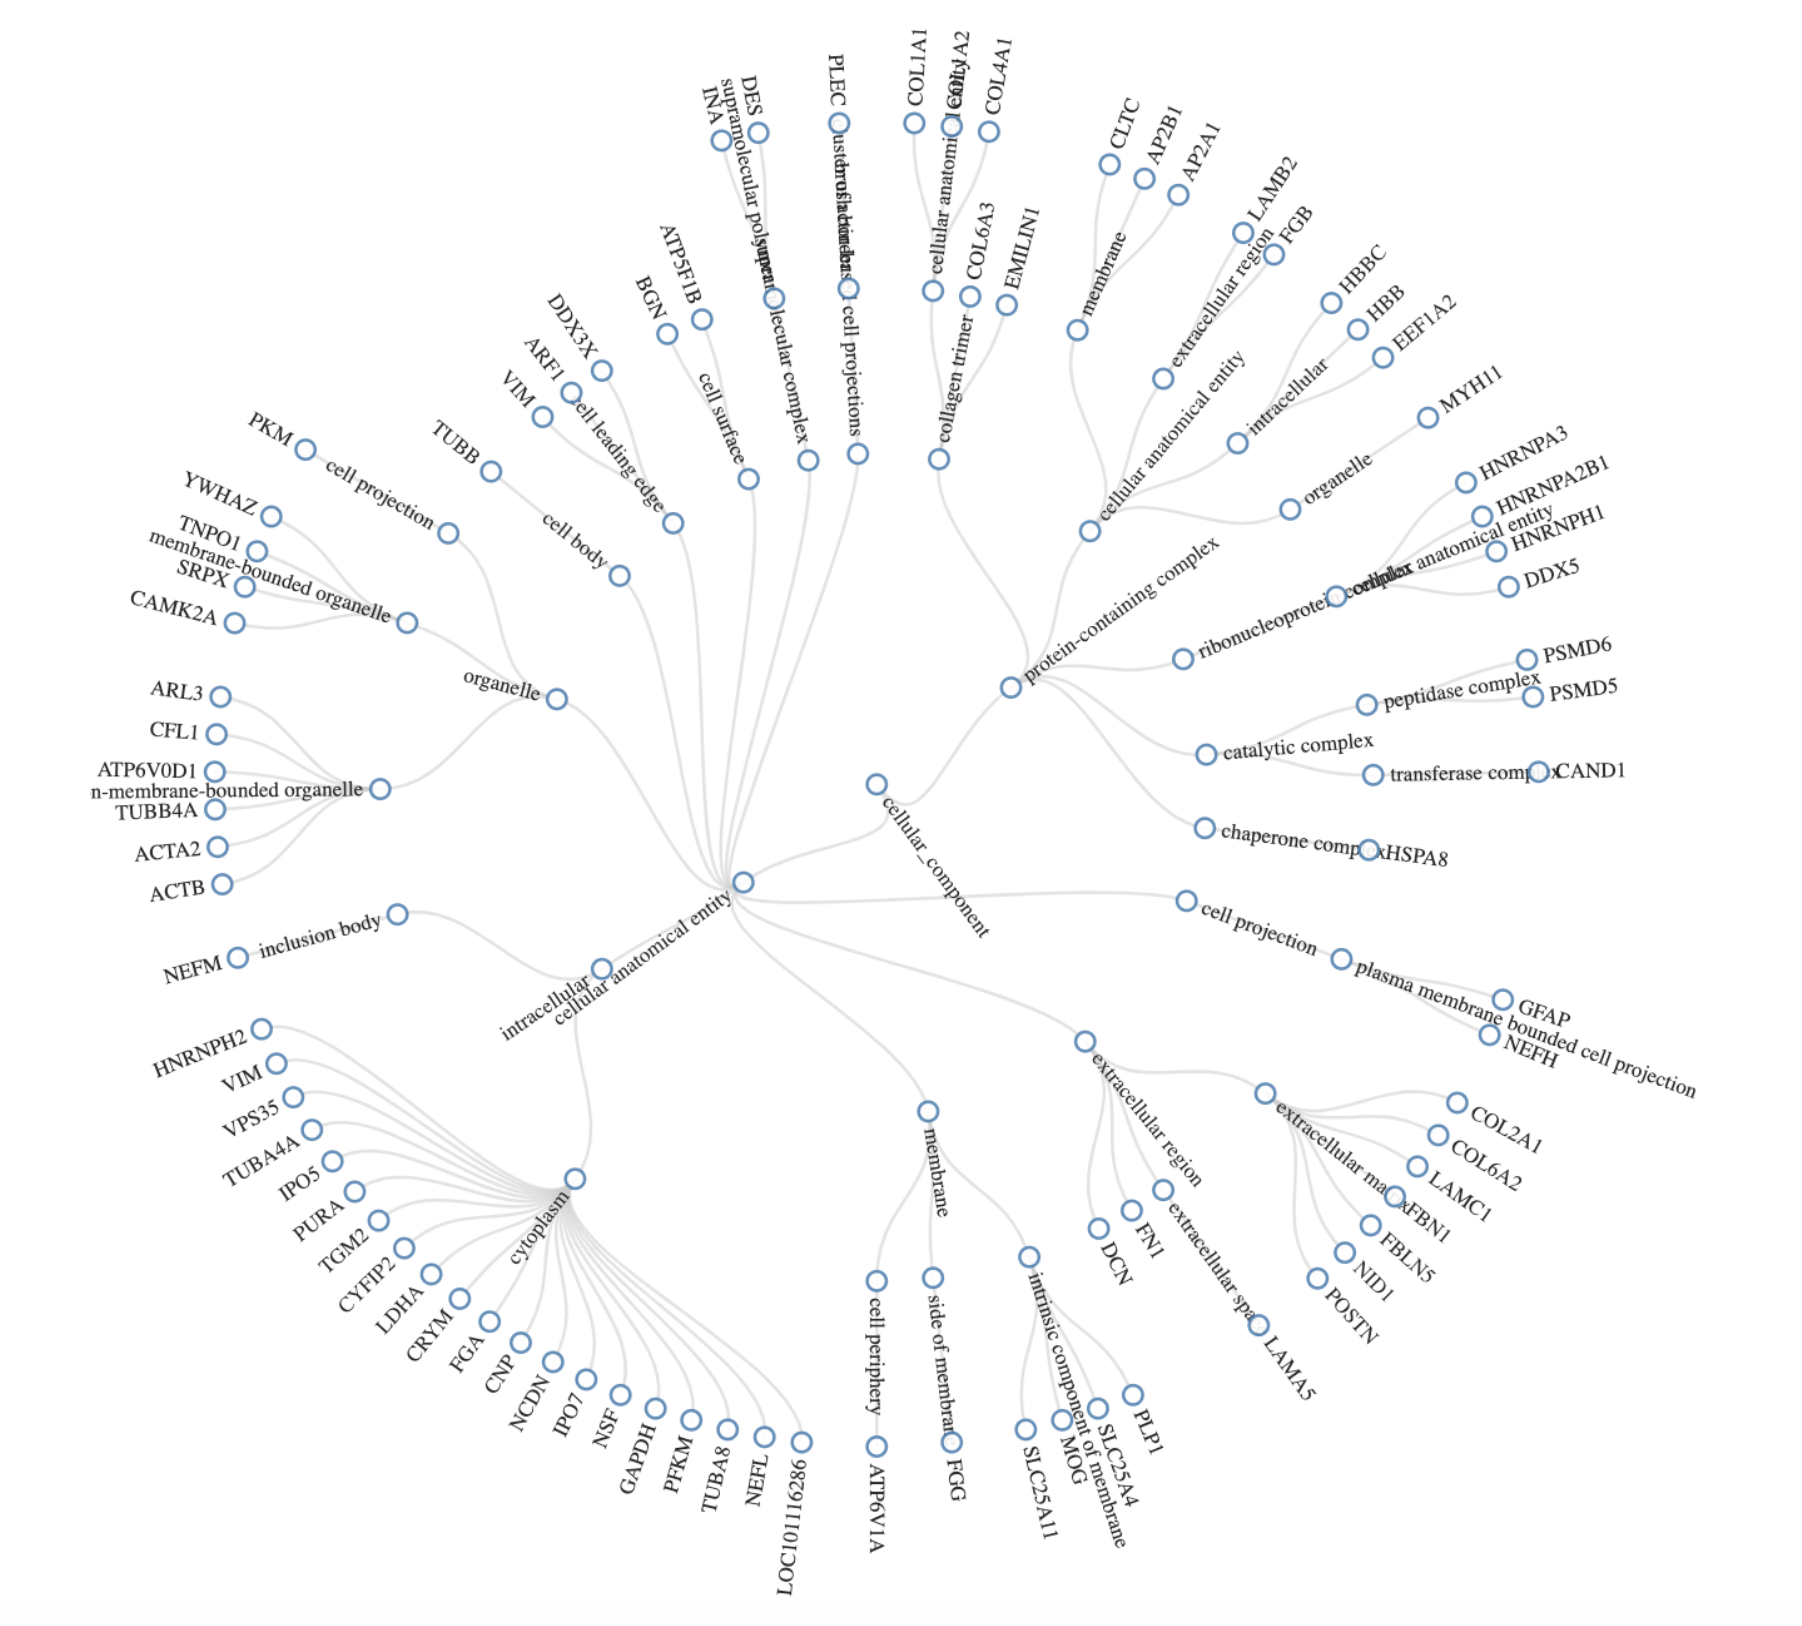
Below is a collection of images that have proved to be useful in projects undertaken in Westmead.
Bioinformatics Figures |
||
|---|---|---|
|
|
|
|
|
|
|
|
|
|
|
|
|
|
|
|
|
|
|
|
|
|
|
|
|
|
|
|
|
|
|
|
|
|
|
|
|
|
|
|
|
|
|
|
|
|
|
|
|
|
|
.png?api=v2)
|
|
|
|
|
|
|

