Effects of 120 g/h of Carbohydrates Intake during a Mountain Marathon on Exercise-Induced Muscle Damage in Elite Runners


 , and
, and
Abstract
:1. Introduction
2. Materials and Methods
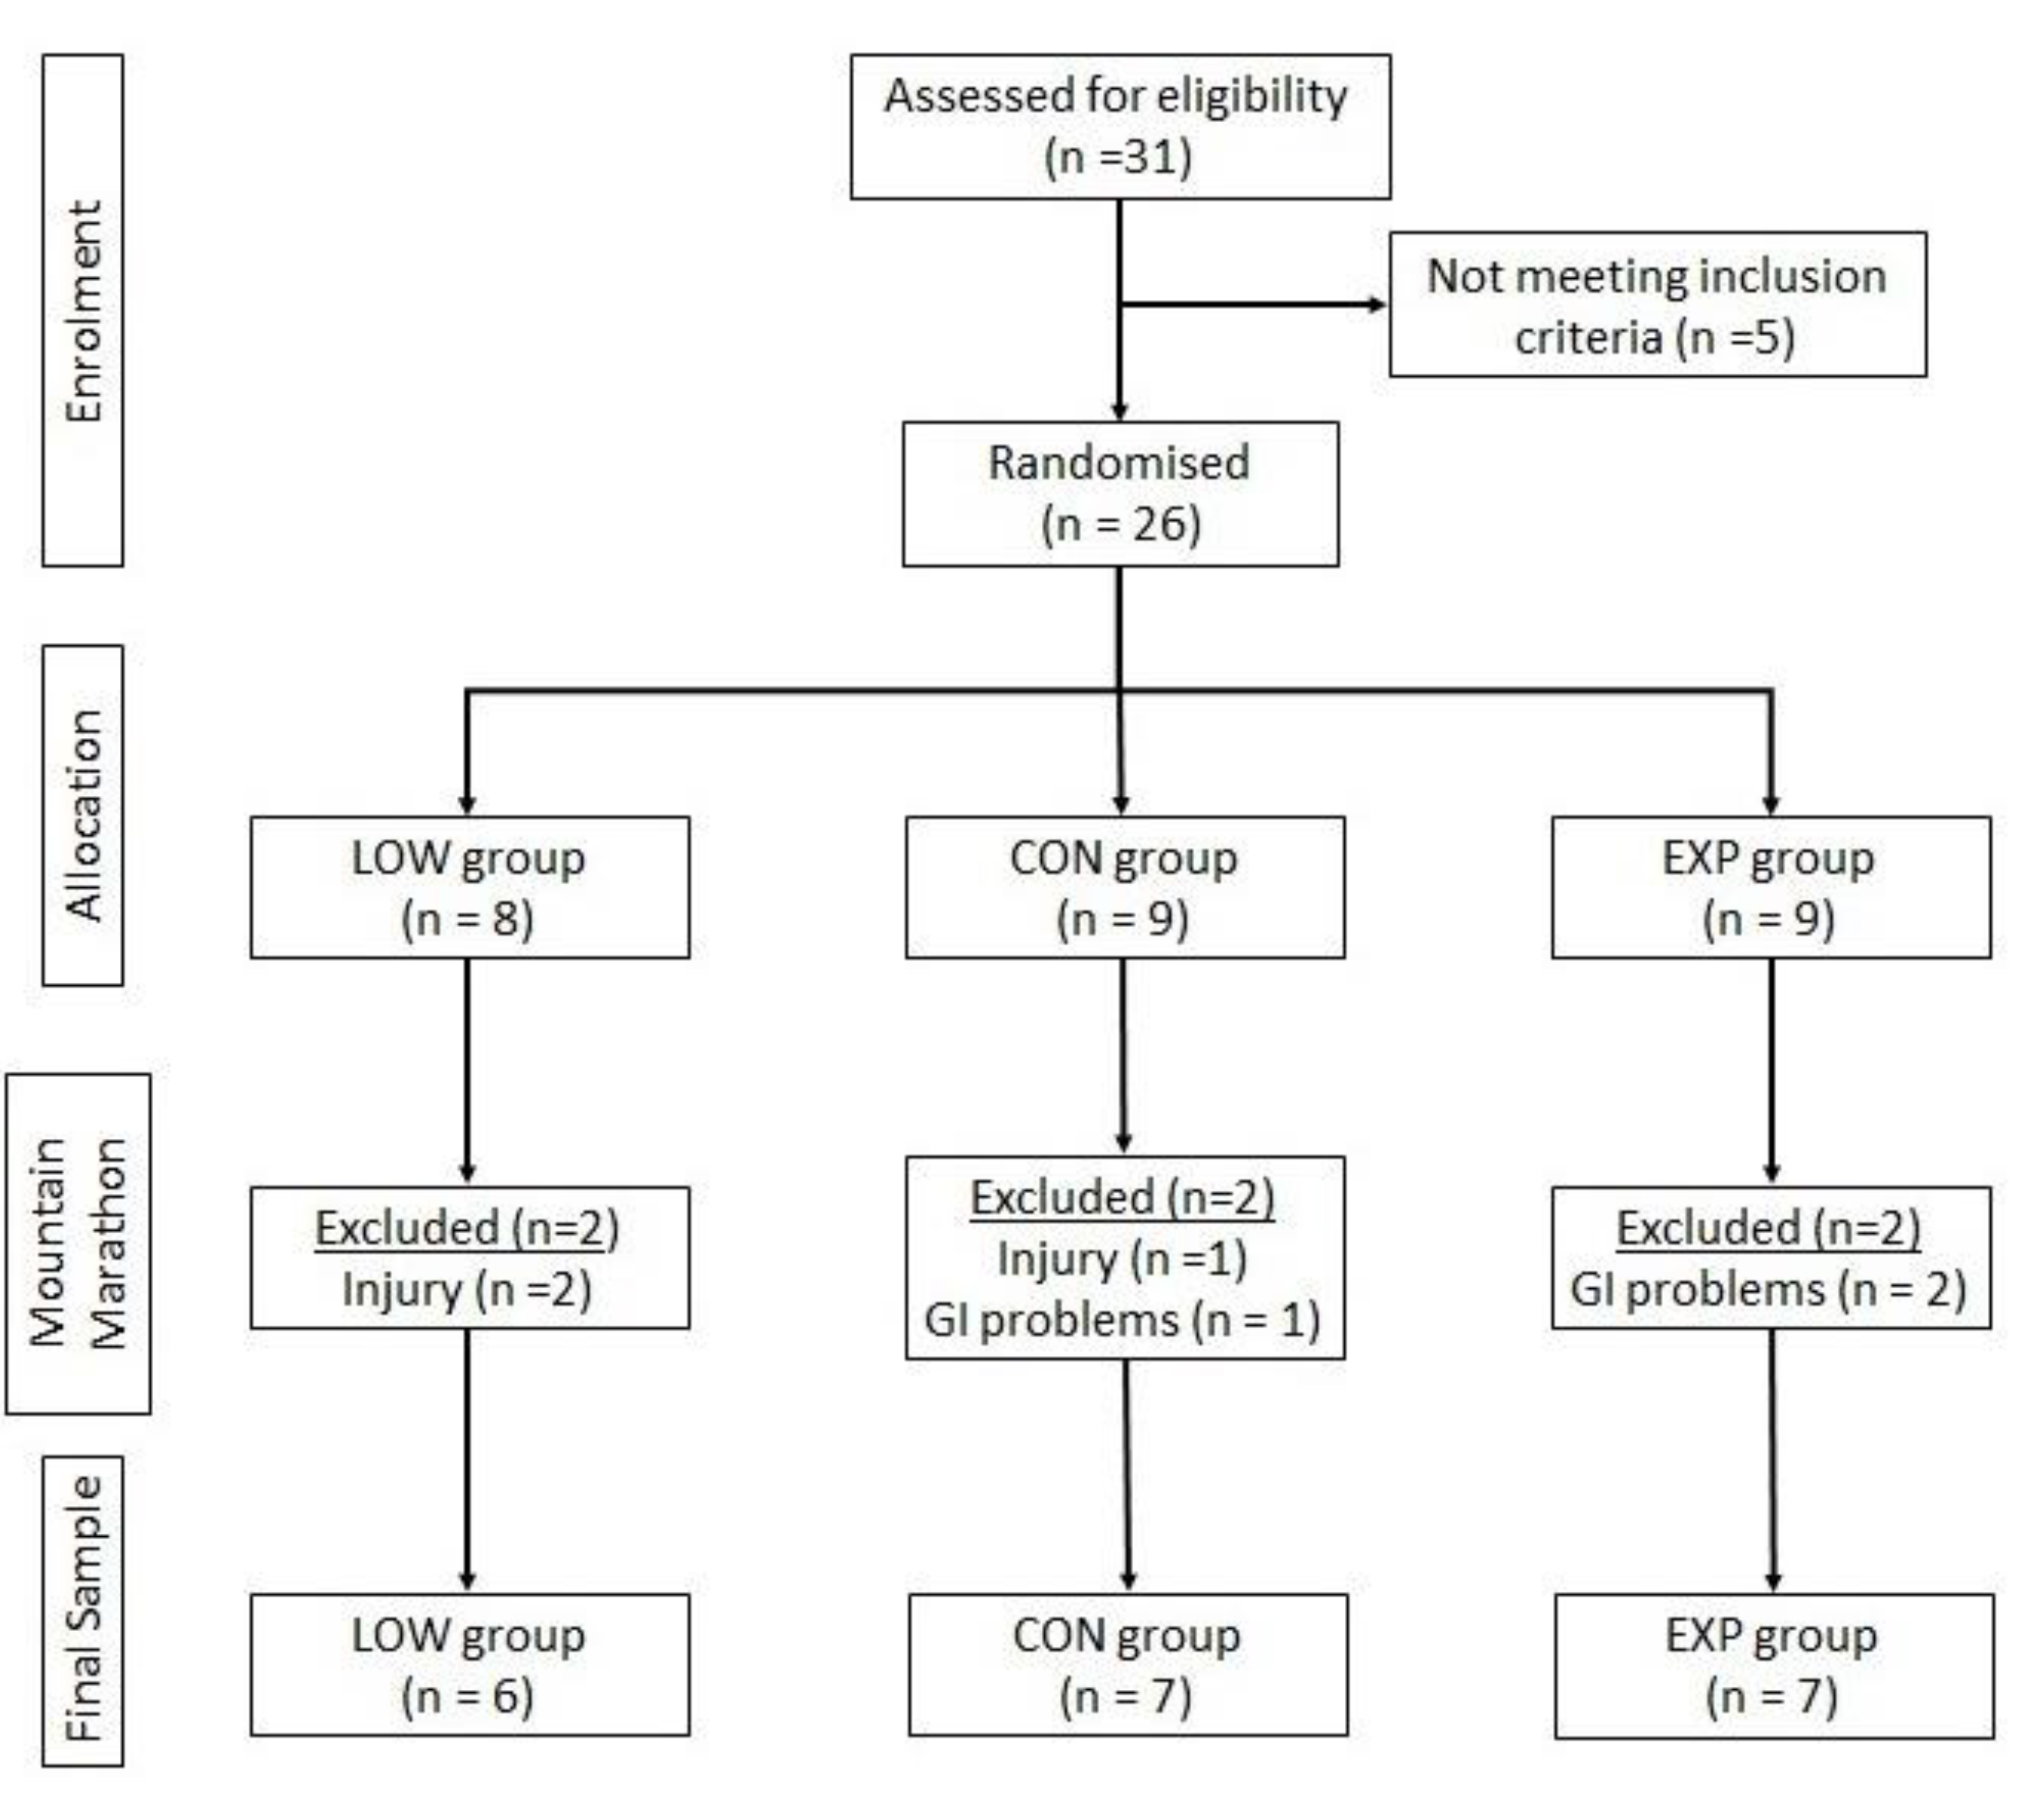
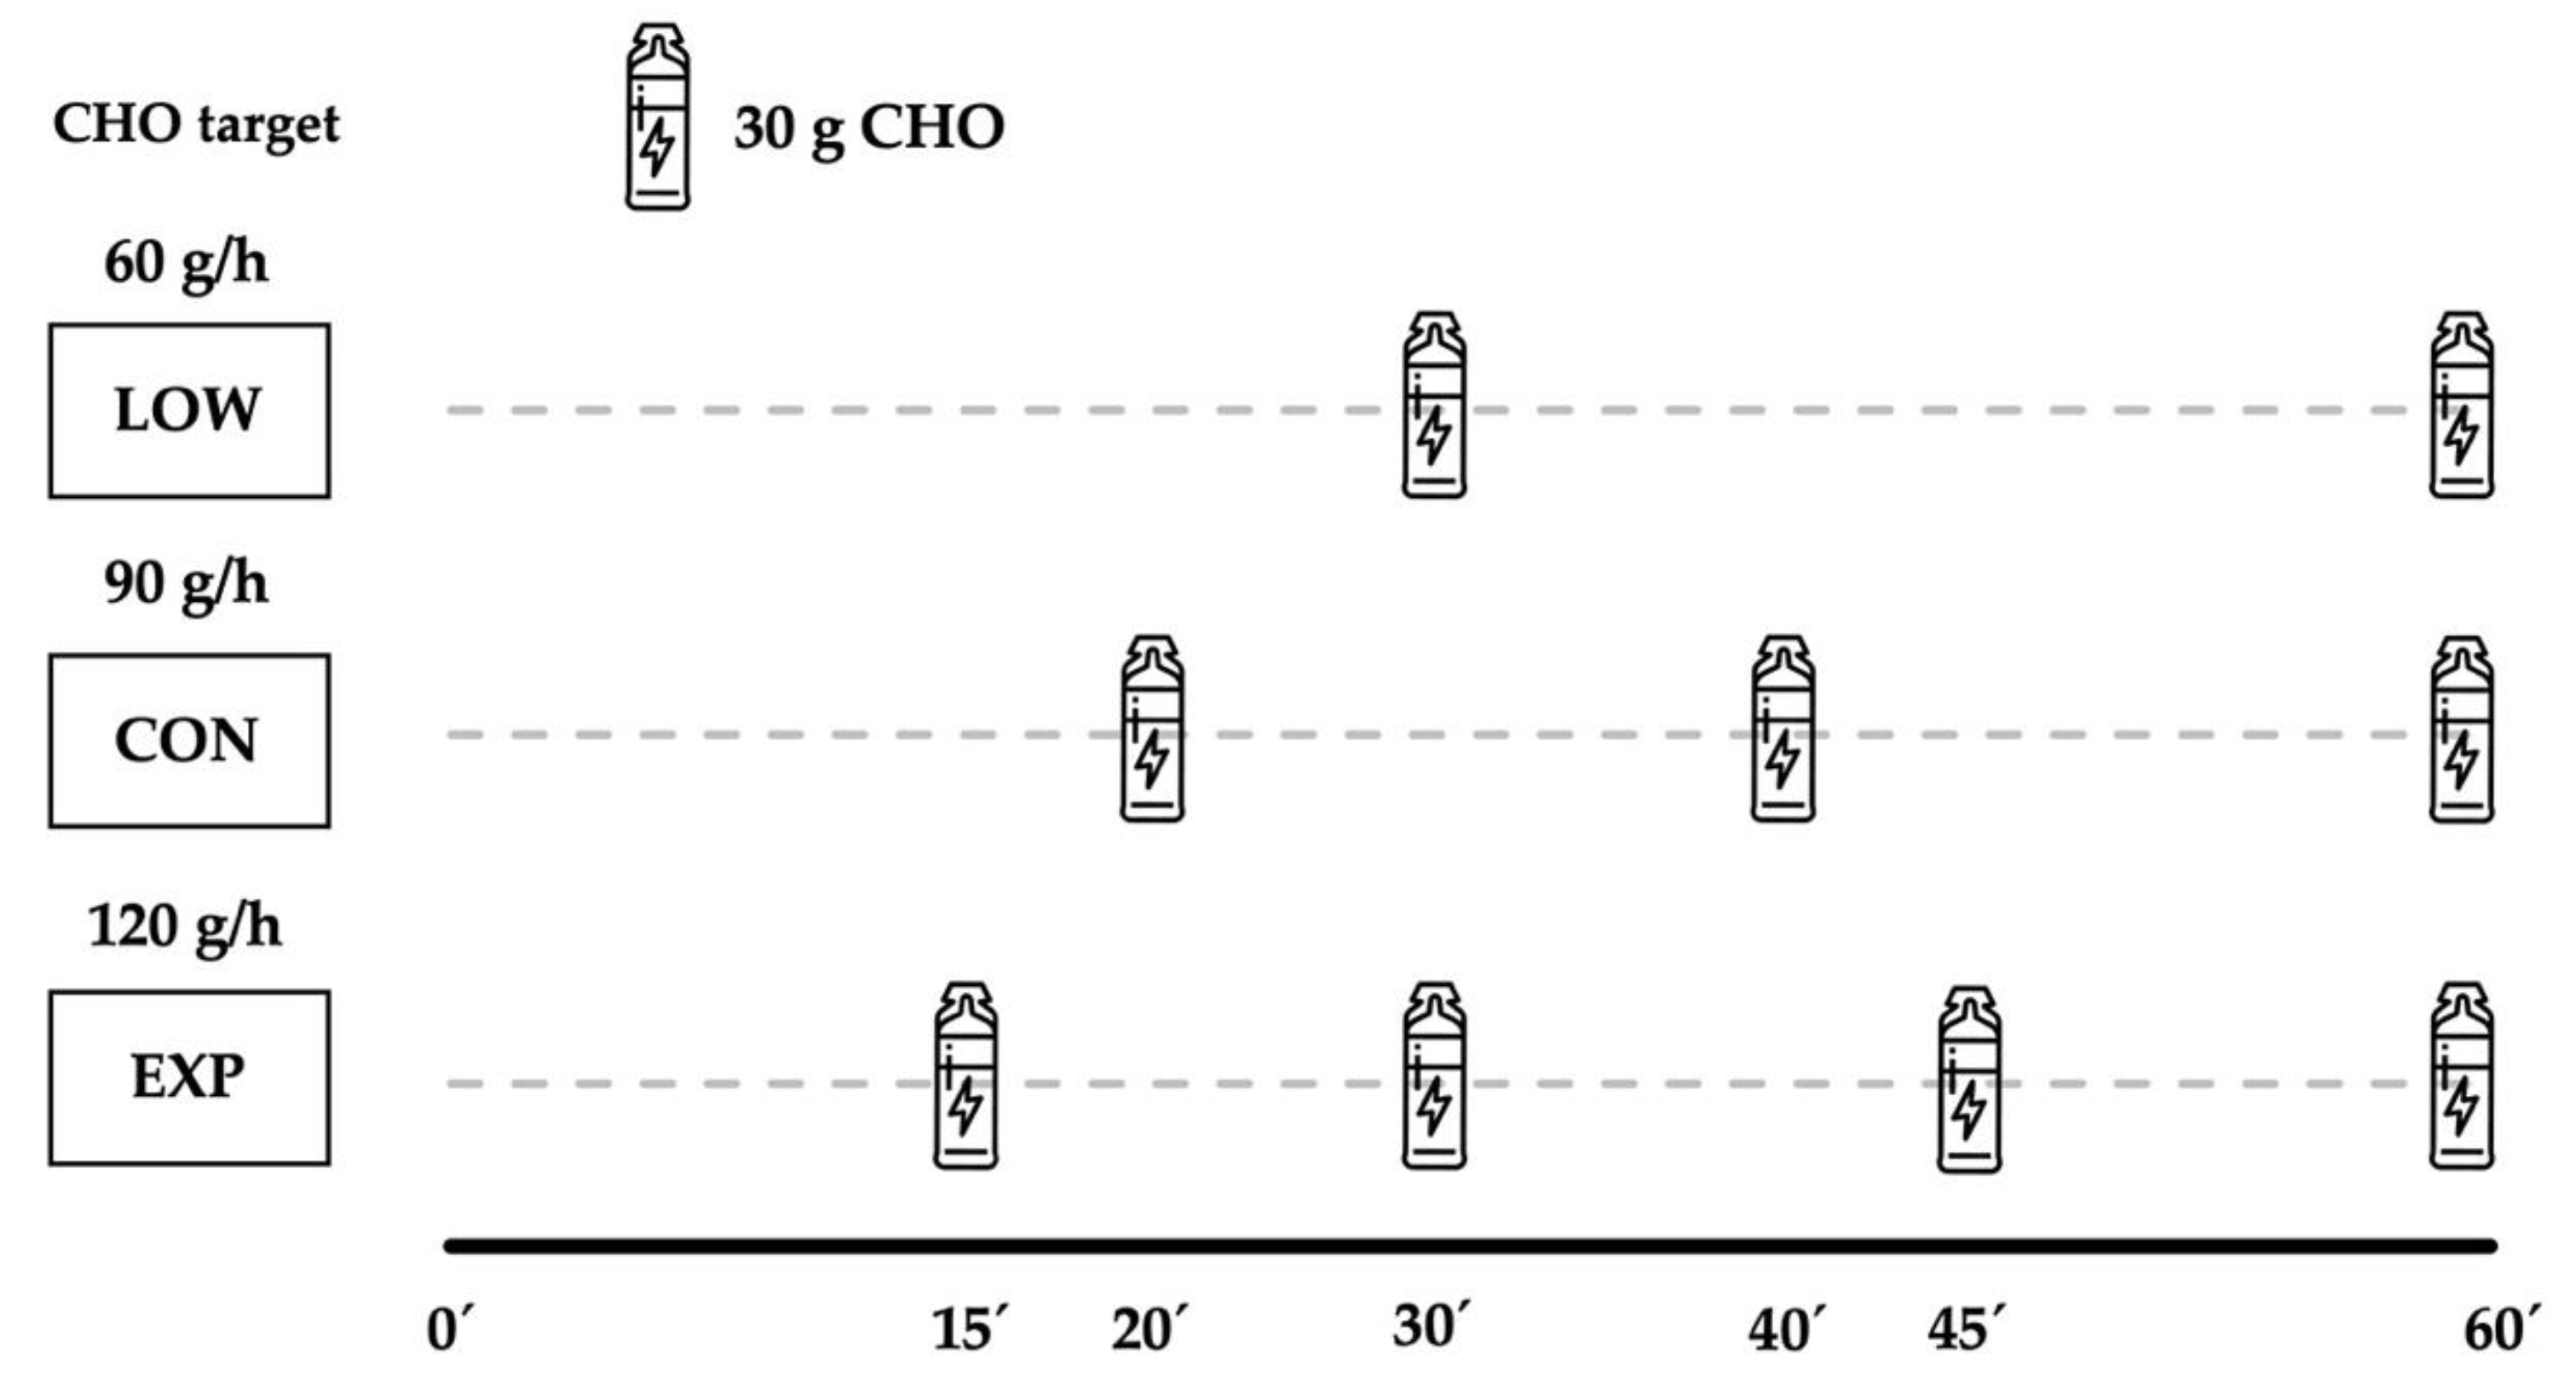
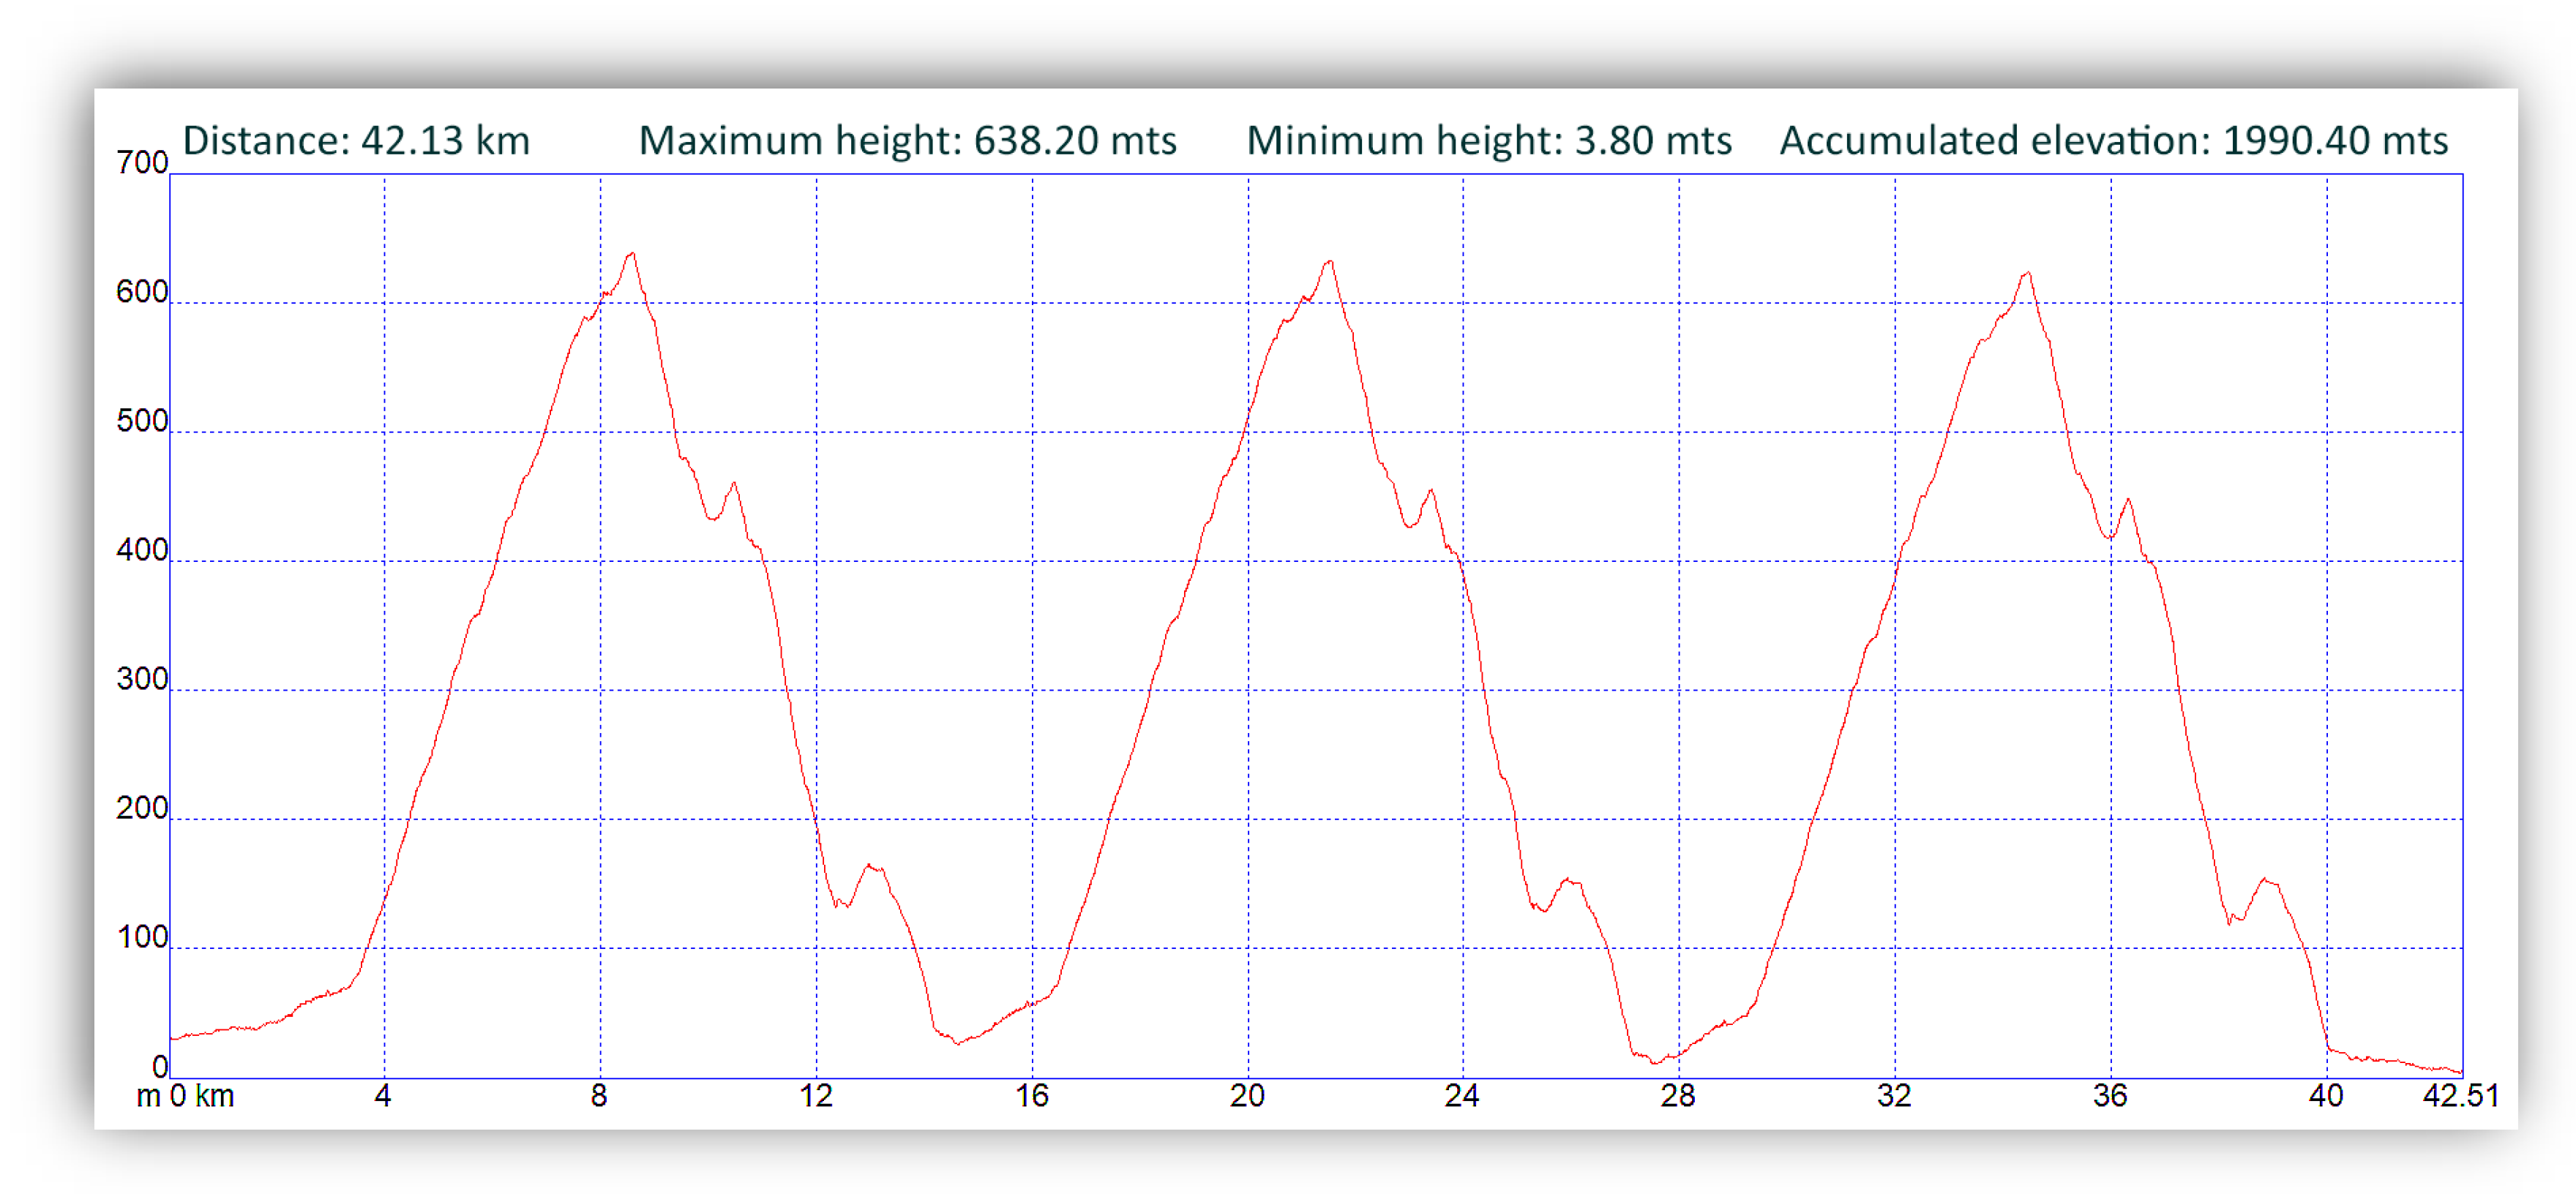
2.1. Experimental Protocol and Participants
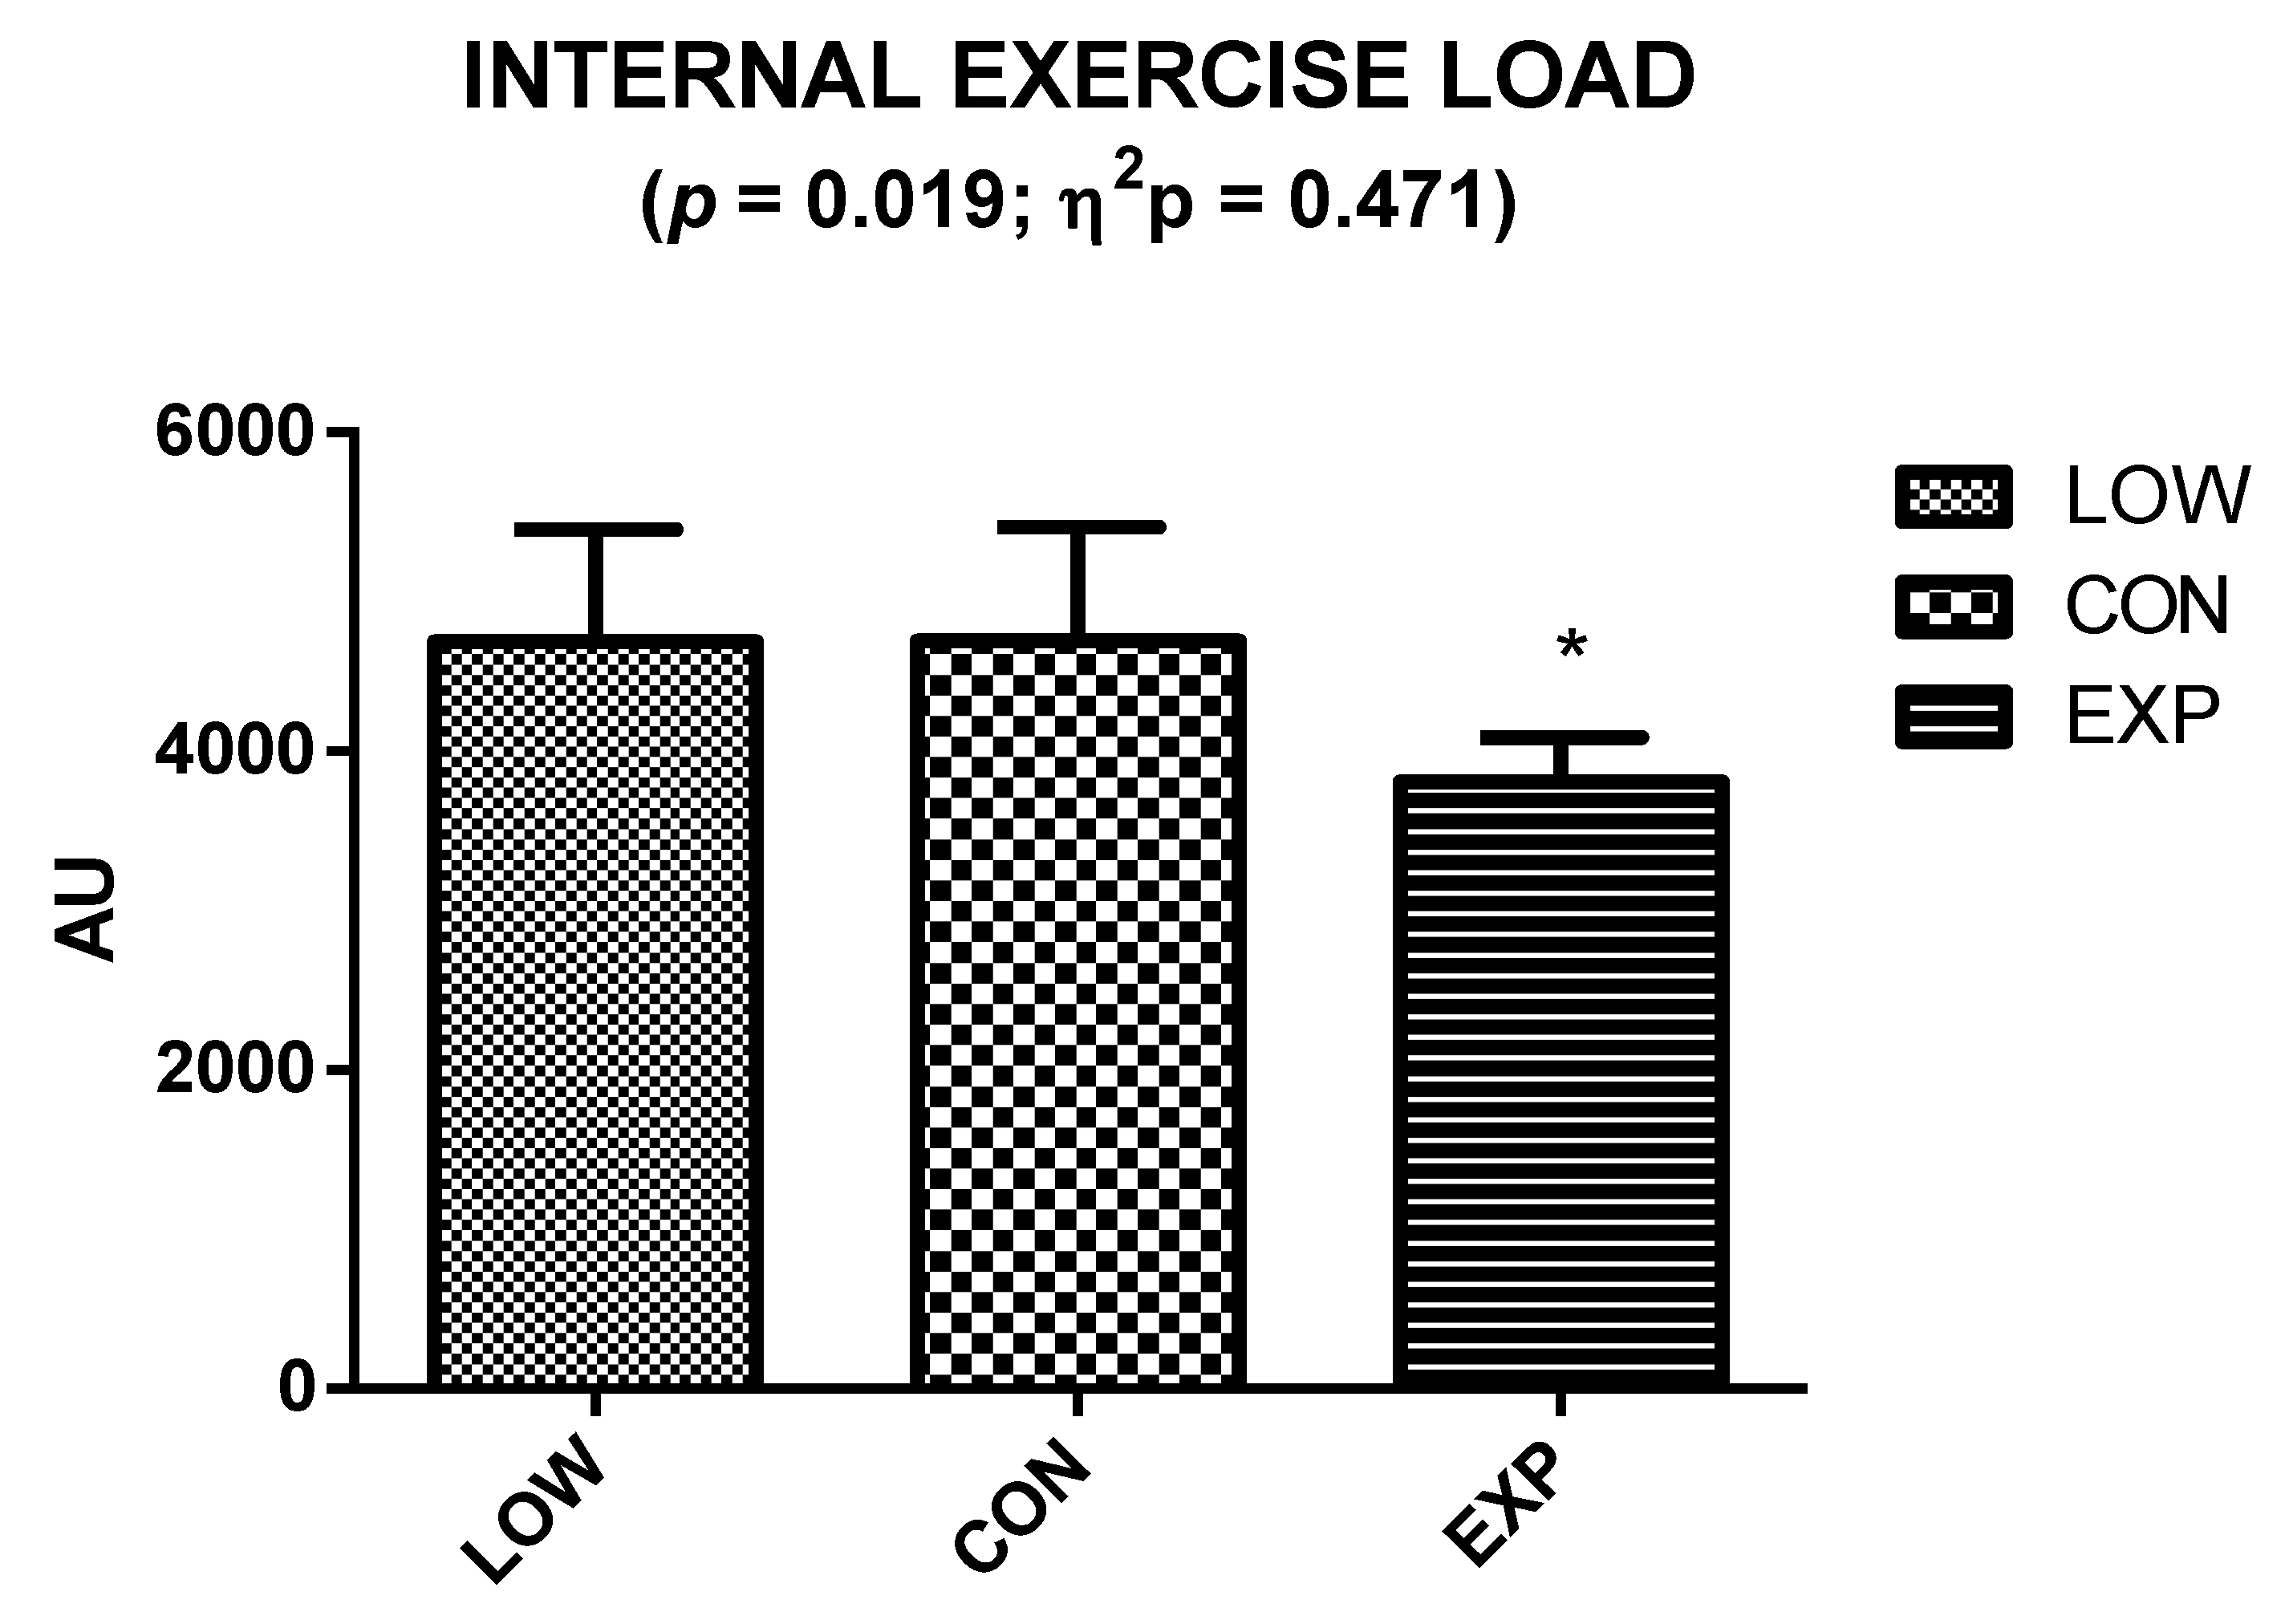
2.2. Internal Exercise Load
2.3. Blood Sample Analysis
2.4. Dietary Assessment
2.5. Statistical Data Analyses
3. Results
4. Discussion
4.1. Limitations, Strengths, and Future Lines
4.2. Practical Applications
5. Conclusions
Author Contributions
Funding
Acknowledgments
Conflicts of Interest
References
- Hoppel, F.; Calabria, E.; Pesta, D.; Kantner-Rumplmair, W.; Gnaiger, E.; Burtscher, M. Physiological and Pathophysiological Responses to Ultramarathon Running in Non-elite Runners. Front. Physiol. 2019, 10, 1300. [Google Scholar] [CrossRef] [Green Version]
- Clemente-Suárez, V. Modificaciones de parámetros bioquímicos después de una maratón de montaña. Eur. J. Hum. Mov. 2011, 27, 75–83. [Google Scholar]
- Knechtle, B.; Nikolaidis, P.T. Physiology and pathophysiology in ultramarathon running. Front. Physiol. 2018, 9, 634. [Google Scholar] [CrossRef] [PubMed] [Green Version]
- Fornasiero, A.; Savoldelli, A.; Fruet, D.; Boccia, G.; Pellegrini, B.; Schena, F. Physiological intensity profile, exercise load and performance predictors of a 65-km mountain ultramarathon. J. Sports Sci. 2018, 36, 1287–1295. [Google Scholar] [CrossRef] [PubMed] [Green Version]
- Owens, D.J.; Twist, C.; Cobley, J.N.; Howatson, G.; Close, G.L. Exercise-induced muscle damage: What is it, what causes it and what are the nutritional solutions? Eur. J. Sport Sci. 2019, 19, 71–85. [Google Scholar] [CrossRef]
- Stellingwerf, T. Case study: Nutrition and training periodization in three elite marathon runners. Int. J. Sport Nutr. Exerc. Metab. 2012, 22, 392–400. [Google Scholar] [CrossRef]
- Roos, L.; Taube, W.; Tuch, C.; Frei, K.M.; Wyss, T. Factors That Influence the Rating of Perceived Exertion after Endurance Training. Int. J. Sports Physiol. Perform. 2018, 13, 1042–1049. [Google Scholar] [CrossRef]
- Haddad, M.; Stylianides, G.; Djaoui, L.; Dellal, A.; Chamari, K. Session-RPE Method for Training Load Monitoring: Validity, Ecological Usefulness, and Influencing Factors. Front. Neurosci. 2017, 11, 612. [Google Scholar] [CrossRef]
- Gavin, J.P.; Myers, S.D.; Willems, M.E.T. The effect of glycogen reduction on cardiorespiratory and metabolic responses during downhill running. Eur. J. Appl. Physiol. 2015, 115, 1125–1133. [Google Scholar] [CrossRef]
- Millet, G.Y.; Tomazin, K.; Verges, S.; Vincent, C.; Bonnefoy, R.; Boisson, R.C.; Gergelé, L.; Féasson, L.; Martin, V. Neuromuscular consequences of an extreme mountain ultramarathon. PLoS ONE 2011, 6, e17059. [Google Scholar] [CrossRef] [Green Version]
- Halson, S.L. Monitoring Training Load to Understand Fatigue in Athletes. Sports Med. 2014, 44, 139–147. [Google Scholar] [CrossRef] [Green Version]
- Borresen, J.; Lambert, M.I. Quantifying training load: A comparison of subjective and objective methods. Int. J. Sports Physiol. Perform. 2008, 3, 16–30. [Google Scholar] [CrossRef] [Green Version]
- Brancaccio, P.; Maffulli, N.; Limongelli, F.M. Creatine kinase monitoring in sport medicine. Br. Med. Bull. 2007, 81–82, 209–230. [Google Scholar] [CrossRef]
- Brancaccio, P.; Lippi, G.; Maffulli, N. Biochemical markers of muscular damage. Clin. Chem. Lab. Med. 2010, 48, 757–767. [Google Scholar] [CrossRef]
- Peake, J.M.; Neubauer, O.; Gatta, P.A.D.; Nosaka, K. Muscle damage and inflammation during recovery from exercise. J. Appl. Physiol. 2017, 122, 559–570. [Google Scholar] [CrossRef]
- Sorichter, S.; Puschendorf, B.; Mair, J. Skeletal muscle injury induced by eccentric muscle action: Muscle proteins as markers of muscle fiber injury. Exerc. Immunol. Rev. 1999, 5, 5–21. [Google Scholar]
- Tee, J.C.; Bosch, A.N.; Lambert, M.I. Metabolic consequences of exercise-induced muscle damage. Sports Med. 2007, 37, 827–836. [Google Scholar] [CrossRef]
- Fatouros, I.G.; Jamurtas, A.Z. Insights into the molecular etiology of exercise-induced inflammation: Opportunities for optimizing performance. J. Inflamm. Res. 2016, 9, 175–186. [Google Scholar] [CrossRef] [Green Version]
- Bernat-Adell, M.D.; Collado-Boira, E.J.; Moles-Julio, P.; Panizo-González, N.; Martínez-Navarro, I.; Hernando-Fuster, B.; Hernando-Domingo, C. Recovery of Inflammation, Cardiac, and Muscle Damage Biomarkers after Running a Marathon. J. Strength Cond. Res. 2019. [Google Scholar] [CrossRef]
- Bird, S.R.; Linden, M.; Hawley, J.A. Acute changes to biomarkers as a consequence of prolonged strenuous running. Ann. Clin. Biochem. 2014, 51, 137–150. [Google Scholar] [CrossRef]
- Da Ponte, A.; Giovanelli, N.; Antonutto, G.; Nigris, D.; Curcio, F.; Cortese, P.; Lazzer, S. Changes in cardiac and muscle biomarkers following an uphill-only marathon. Res. Sports Med. 2018, 26, 100–111. [Google Scholar] [CrossRef]
- Shin, K.-A.; Park, K.D.; Ahn, J.; Park, Y.; Kim, Y.-J. Comparison of Changes in Biochemical Markers for Skeletal Muscles, Hepatic Metabolism, and Renal Function after Three Types of Long-distance Running: Observational Study. Medicine 2016, 95, e3657. [Google Scholar] [CrossRef]
- Lippi, G.; Schena, F.; Salvagno, G.L.; Montagnana, M.; Gelati, M.; Tarperi, C.; Banfi, G.; Guidi, G.C. Acute variation of biochemical markers of muscle damage following a 21-km, half-marathon run. Scand. J. Clin. Lab. Investig. 2008, 68, 667–672. [Google Scholar] [CrossRef]
- Nielsen, J.; Ørtenblad, N. Physiological aspects of the subcellular localization of glycogen in skeletal muscle. Appl. Physiol. Nutr. Metab. Physiol. Appl. Nutr. Metab. 2013, 38, 91–99. [Google Scholar] [CrossRef]
- Ørtenblad, N.; Nielsen, J. Muscle glycogen and cell function--Location, location, location. Scand. J. Med. Sci. Sports 2015, 25 (Suppl. 4), 34–40. [Google Scholar]
- Ørtenblad, N.; Nielsen, J.; Saltin, B.; Holmberg, H.-C. Role of glycogen availability in sarcoplasmic reticulum Ca2+ kinetics in human skeletal muscle. J. Physiol. 2011, 589, 711–725. [Google Scholar] [CrossRef]
- Clarkson, P.M.; Hubal, M.J. Exercise-induced muscle damage in humans. Am. J. Phys. Med. Rehabil. 2002, 81, S52–S69. [Google Scholar] [CrossRef]
- Kano, Y.; Sonobe, T.; Inagaki, T.; Sudo, M.; Poole, D.C. Mechanisms of exercise-induced muscle damage and fatigue: Intracellular calcium accumulation. J. Phys. Fit. Sports Med. 2012, 1, 505–512. [Google Scholar] [CrossRef] [Green Version]
- Bishop, N.C.; Gleeson, M.; Nicholas, C.W.; Ali, A. Influence of carbohydrate supplementation on plasma cytokine and neutrophil degranulation responses to high intensity intermittent exercise. Int. J. Sport Nutr. Exerc. Metab. 2002, 12, 145–156. [Google Scholar] [CrossRef]
- Nieman, D.C.; Dumke, C.I.; Henson, D.A.; McAnulty, S.R.; McAnulty, L.S.; Lind, R.H.; Morrow, J.D. Immune and oxidative changes during and following the Western States Endurance Run. Int. J. Sports Med. 2003, 24, 541–547. [Google Scholar]
- Nybo, L. CNS fatigue and prolonged exercise: Effect of glucose supplementation. Med. Sci. Sports Exerc. 2003, 35, 589–594. [Google Scholar] [CrossRef]
- Tiller, N.B.; Roberts, J.D.; Beasley, L.; Chapman, S.; Pinto, J.M.; Smith, L.; Wiffin, M.; Russell, M.; Sparks, S.A.; Duckworth, L.; et al. International Society of Sports Nutrition Position Stand: Nutritional considerations for single-stage ultramarathon training and racing. J. Int. Soc. Sports Nutr. 2019, 16, 50. [Google Scholar] [CrossRef] [Green Version]
- Jeukendrup, A.E. Nutrition for endurance sports: Marathon, triathlon, and road cycling. J. Sports Sci. 2011, 29, S91–S99. [Google Scholar] [CrossRef]
- Thomas, D.T.; Erdman, K.A.; Burke, L.M. American College of Sports Medicine Joint Position Statement. Nutrition and Athletic Performance. Med. Sci. Sports Exerc. 2016, 48, 543–568. [Google Scholar]
- Jeukendrup, A.E. Training the Gut for Athletes. Sports Med. 2017, 47, 101–110. [Google Scholar] [CrossRef] [Green Version]
- Burke, L.M.; Jeukendrup, A.E.; Jones, A.M.; Mooses, M. Contemporary Nutrition Strategies to Optimize Performance in Distance Runners and Race Walkers. Int. J. Sport Nutr. Exerc. Metab. 2019, 29, 117–129. [Google Scholar] [CrossRef] [Green Version]
- Afshar, N.; Safaei, S.; Nickerson, D.P.; Hunter, P.J.; Suresh, V. Computational Modeling of Glucose Uptake in the Enterocyte. Front. Physiol. 2019, 10, 380. [Google Scholar] [CrossRef]
- Scow, J.S.; Tavakkolizadeh, A.; Zheng, Y.; Sarr, M.G. Acute “adaptation” by the small intestinal enterocyte: A posttranscriptional mechanism involving apical translocation of nutrient transporters. Surgery 2011, 149, 601–605. [Google Scholar] [CrossRef] [Green Version]
- King, A.J.; O’Hara, J.P.; Arjomandkhah, N.C.; Rowe, J.; Morrison, D.J.; Preston, T.; King, R.F.G.J. Liver and muscle glycogen oxidation and performance with dose variation of glucose-fructose ingestion during prolonged (3 h) exercise. Eur. J. Appl. Physiol. 2019, 119, 1157–1169. [Google Scholar] [CrossRef] [Green Version]
- King, A.J.; O’Hara, J.P.; Morrison, D.J.; Preston, T.; King, R.F.G.J. Carbohydrate dose influences liver and muscle glycogen oxidation and performance during prolonged exercise. Physiol. Rep. 2018, 6, e13555. [Google Scholar] [CrossRef] [Green Version]
- Pfeiffer, B.; Stellingwerff, T.; Hodgson, A.B.; Randell, R.; Pöttgen, K.; Res, P.; Jeukendrup, A.E. Nutritional intake and gastrointestinal problems during competitive endurance events. Med. Sci. Sports Exerc. 2012, 44, 344–351. [Google Scholar] [CrossRef] [Green Version]
- Doyle, J.A.; Sherman, W.M.; Strauss, R.L. Effects of eccentric and concentric exercise on muscle glycogen replenishment. J. Appl. Physiol. 1993, 74, 1848–1855. [Google Scholar] [CrossRef]
- Asp, S.; Daugaard, J.R.; Kristiansen, S.; Kiens, B.; Richter, E.A. Eccentric exercise decreases maximal insulin action in humans: Muscle and systemic effects. J. Physiol. 1996, 494 Pt 3, 891–898. [Google Scholar] [CrossRef]
- Costa, R.; Miall, A.; Khoo, A.; Rauch, C.; Snipe, R.; Costa, V.; Gibson, P. Gut-training: The impact of two weeks repetitive gut-challenge during exercise on gastrointestinal status, glucose availability, fuel kinetics, and running performance. Appl. Physiol. Nutr. Metab. 2017, 42, 547–557. [Google Scholar] [CrossRef] [Green Version]
- Australian Institute of Sport. ABCD Classification System. Australian Institute of Sport. 2017. Available online: https://ais.gov.au/nutrition/supplements#group_a (accessed on 18 April 2020).
- Trommelen, J.; Fuchs, C.J.; Beelen, M.; Lenaerts, K.; Jeukendrup, A.E.; Cermak, N.M.; Van Loon, L.J.C. Fructose and sucrose intake increase exogenous carbohydrate oxidation during exercise. Nutrients 2017, 9, 167. [Google Scholar] [CrossRef] [Green Version]
- Jeukendrup, A. A step towards personalized sports nutrition: Carbohydrate intake during exercise. Sports Med. 2014, 44, 25–33. [Google Scholar] [CrossRef] [Green Version]
- Karasov, W.H. Integrative physiology of transcellular and paracellular intestinal absorption. J. Exp. Biol. 2017, 220, 2495–2501. [Google Scholar] [CrossRef] [Green Version]
- Ferraris, R.P.; Choe, J.-Y.; Patel, C.R. Intestinal Absorption of Fructose. Annu. Rev. Nutr. 2018, 38, 41–67. [Google Scholar] [CrossRef]
- Foster, C.; Daines, E.; Hector, L.; Snyder, A.C.; Welsh, R. Athletic performance in relation to training load. Wis. Med. J. 1996, 95, 370–374. [Google Scholar]
- Mielgo-Ayuso, J.; Calleja-González, J.; Refoyo, I.; León-Guereño, P.; Cordova, A.; Del Coso, J. Exercise-Induced Muscle Damage and Cardiac Stress during a Marathon Could be Associated with Dietary Intake during the Week before the Race. Nutrients 2020, 12, 316. [Google Scholar] [CrossRef] [Green Version]
- Murray, B.; Rosenbloom, C. Fundamentals of glycogen metabolism for coaches and athletes. Nutr. Rev. 2018, 76, 243–259. [Google Scholar] [CrossRef] [PubMed] [Green Version]
- Burke, L.M.; Van Loon, L.J.C.; Hawley, J.A. Postexercise muscle glycogen resynthesis in humans. J. Appl. Physiol. 2017, 122, 1055–1067. [Google Scholar] [CrossRef] [PubMed] [Green Version]
- Ferguson, C.J. An Effect Size Primer: A Guide for Clinicians and Researchers. Prof. Psychol. Res. Pract. 2009, 40, 532–538. [Google Scholar]
- Balducci, P.; Clémençon, M.; Trama, R.; Blache, Y.; Hautier, C. Performance Factors in a Mountain Ultramarathon. Int. J. Sports Med. 2017, 38, 819–826. [Google Scholar] [CrossRef]
- Saunders, M.J.; Kane, M.D.; Todd, M.K. Effects of a carbohydrate-protein beverage on cycling endurance and muscle damage. Med. Sci. Sports Exerc. 2004, 36, 1233–1238. [Google Scholar] [CrossRef] [Green Version]
- Cockburn, E.; Stevenson, E.; Hayes, P.R.; Robson-Ansley, P.; Howatson, G. Effect of milk-based carbohydrate-protein supplement timing on the attenuation of exercise-induced muscle damage. Appl. Physiol. Nutr. Metab. Physiol. Appl. Nutr. Metab. 2010, 35, 270–277. [Google Scholar] [CrossRef]
- Hall, A.H.; Leveritt, M.D.; Ahuja, K.D.K.; Shing, C.M. Coingestion of carbohydrate and protein during training reduces training stress and enhances subsequent exercise performance. Appl. Physiol. Nutr. Metab. Physiol. Appl. Nutr. Metab. 2013, 38, 597–604. [Google Scholar] [CrossRef]
- Kerksick, C.M.; Arent, S.; Schoenfeld, B.J.; Stout, J.R.; Campbell, B.; Wilborn, C.D.; Taylor, L.; Kalman, D.; Smith-Ryan, A.E.; Kreider, R.B.; et al. International society of sports nutrition position stand: Nutrient timing. J. Int. Soc. Sports Nutr. 2017, 14, 33. [Google Scholar] [CrossRef]
- Cheng, A.J.; Jude, B.; Lanner, J.T. Intramuscular mechanisms of overtraining. Redox Biol. 2020, 101480. [Google Scholar] [CrossRef]
- Banfi, G.; Colombini, A.; Lombardi, G.; Lubkowska, A. Metabolic markers in sports medicine. Adv. Clin. Chem. 2012, 56, 2. [Google Scholar]
- Koch, A.J.; Pereira, R.; Machado, M. The creatine kinase response to resistance exercise. J. Musculoskelet. Neuronal Interact. 2014, 14, 68–77. [Google Scholar] [PubMed]
- Kuipers, H. Exercise-induced muscle damage. Int. J. Sports Med. 1994, 15, 132–135. [Google Scholar] [CrossRef] [PubMed]
- Byrne, C.; Eston, R.; Edwards, R. Characteristics of isometric and dynamic strength loss following eccentric exercise-induced muscle damage. Scand. J. Med. Sci. Sports 2001, 11, 134–140. [Google Scholar] [CrossRef]
- Pokora, I.; Kempa, K.; Chrapusta, S.J.; Langfort, J. Effects of downhill and uphill exercises of equivalent submaximal intensities on selected blood cytokine levels and blood creatine kinase activity. Biol. Sport 2014, 31, 173–178. [Google Scholar] [CrossRef]
- Miles, M.P.; Walker, E.E.; Conant, S.B.; Hogan, S.P.; Kidd, J.R. Carbohydrate influences plasma interleukin-6 but not C-reactive protein or creatine kinase following a 32-km mountain trail race. Int. J. Sport Nutr. Exerc. Metab. 2006, 16, 36–46. [Google Scholar] [CrossRef] [Green Version]
- Hearris, M.A.; Hammond, K.M.; Fell, J.M.; Morton, J.P. Regulation of Muscle Glycogen Metabolism during Exercise: Implications for Endurance Performance and Training Adaptations. Nutrients 2018, 10, 298. [Google Scholar] [CrossRef] [Green Version]
- Philp, A.; Hargreaves, M.; Baar, K. More than a store: Regulatory roles for glycogen in skeletal muscle adaptation to exercise. Am. J. Physiol. Endocrinol. Metab. 2012, 302, E1343–E1351. [Google Scholar] [CrossRef] [Green Version]
- Jensen, R.; Nielsen, J.; Ørtenblad, N. Inhibition of glycogenolysis prolongs action potential repriming period and impairs muscle function in rat skeletal muscle. J. Physiol. 2020, 598, 789–803. [Google Scholar] [CrossRef]
- Widrick, J.J.; Costill, D.L.; McConell, G.K.; Anderson, D.E.; Pearson, D.R.; Zachwieja, J.J. Time course of glycogen accumulation after eccentric exercise. J. Appl. Physiol. 1992, 72, 1999–2004. [Google Scholar] [CrossRef]
- Costill, D.L.; Pascoe, D.D.; Fink, W.J.; Robergs, R.A.; Barr, S.I.; Pearson, D. Impaired muscle glycogen resynthesis after eccentric exercise. J. Appl. Physiol. 1990, 69, 46–50. [Google Scholar] [CrossRef]
- Asp, S.; Daugaard, J.R.; Richter, E.A. Eccentric exercise decreases glucose transporter GLUT4 protein in human skeletal muscle. J. Physiol. 1995, 482 Pt 3, 705–712. [Google Scholar] [CrossRef] [Green Version]
- Kirwan, J.P.; Hickner, R.C.; Yarasheski, K.E.; Kohrt, W.M.; Wiethop, B.V.; Holloszy, J.O. Eccentric exercise induces transient insulin resistance in healthy individuals. J. Appl. Physiol. 1992, 72, 2197–2202. [Google Scholar] [CrossRef] [PubMed]
- Richter, E.A.; Hargreaves, M. Exercise, GLUT4, and skeletal muscle glucose uptake. Physiol. Rev. 2013, 93, 993–1017. [Google Scholar] [CrossRef] [PubMed] [Green Version]
- Klip, A.; McGraw, T.E.; James, D.E. Thirty sweet years of GLUT4. J. Biol. Chem. 2019, 294, 11369–11381. [Google Scholar] [CrossRef] [PubMed] [Green Version]
- Hennigar, S.R.; McClung, J.P.; Pasiakos, S.M. Nutritional interventions and the IL-6 response to exercise. FASEB J. Off. Publ. Fed. Am. Soc. Exp. Biol. 2017, 31, 3719–3728. [Google Scholar] [CrossRef] [PubMed] [Green Version]
- Isaacs, A.W.; Macaluso, F.; Smith, C.; Myburgh, K.H. C-Reactive Protein Is Elevated Only in High Creatine Kinase Responders to Muscle Damaging Exercise. Front. Physiol. 2019, 10, 86. [Google Scholar] [CrossRef] [Green Version]
- Close, G.L.; Hamilton, D.L.; Philp, A.; Burke, L.M.; Morton, J.P. New strategies in sport nutrition to increase exercise performance. Free Radic. Biol. Med. 2016, 98, 144–158. [Google Scholar] [CrossRef] [Green Version]


| T1 | T2 | p | ŋ2p | |
|---|---|---|---|---|
| Glucose | ||||
| LOW | 92.5 ± 8.7 | 89.7 ± 5.9 | 0.433 | 0.099 |
| CON | 91.1 ± 5.8 | 85.6 ± 10.2 | ||
| EXP | 91.4 ± 7.7 | 89.3 ± 7.7 | ||
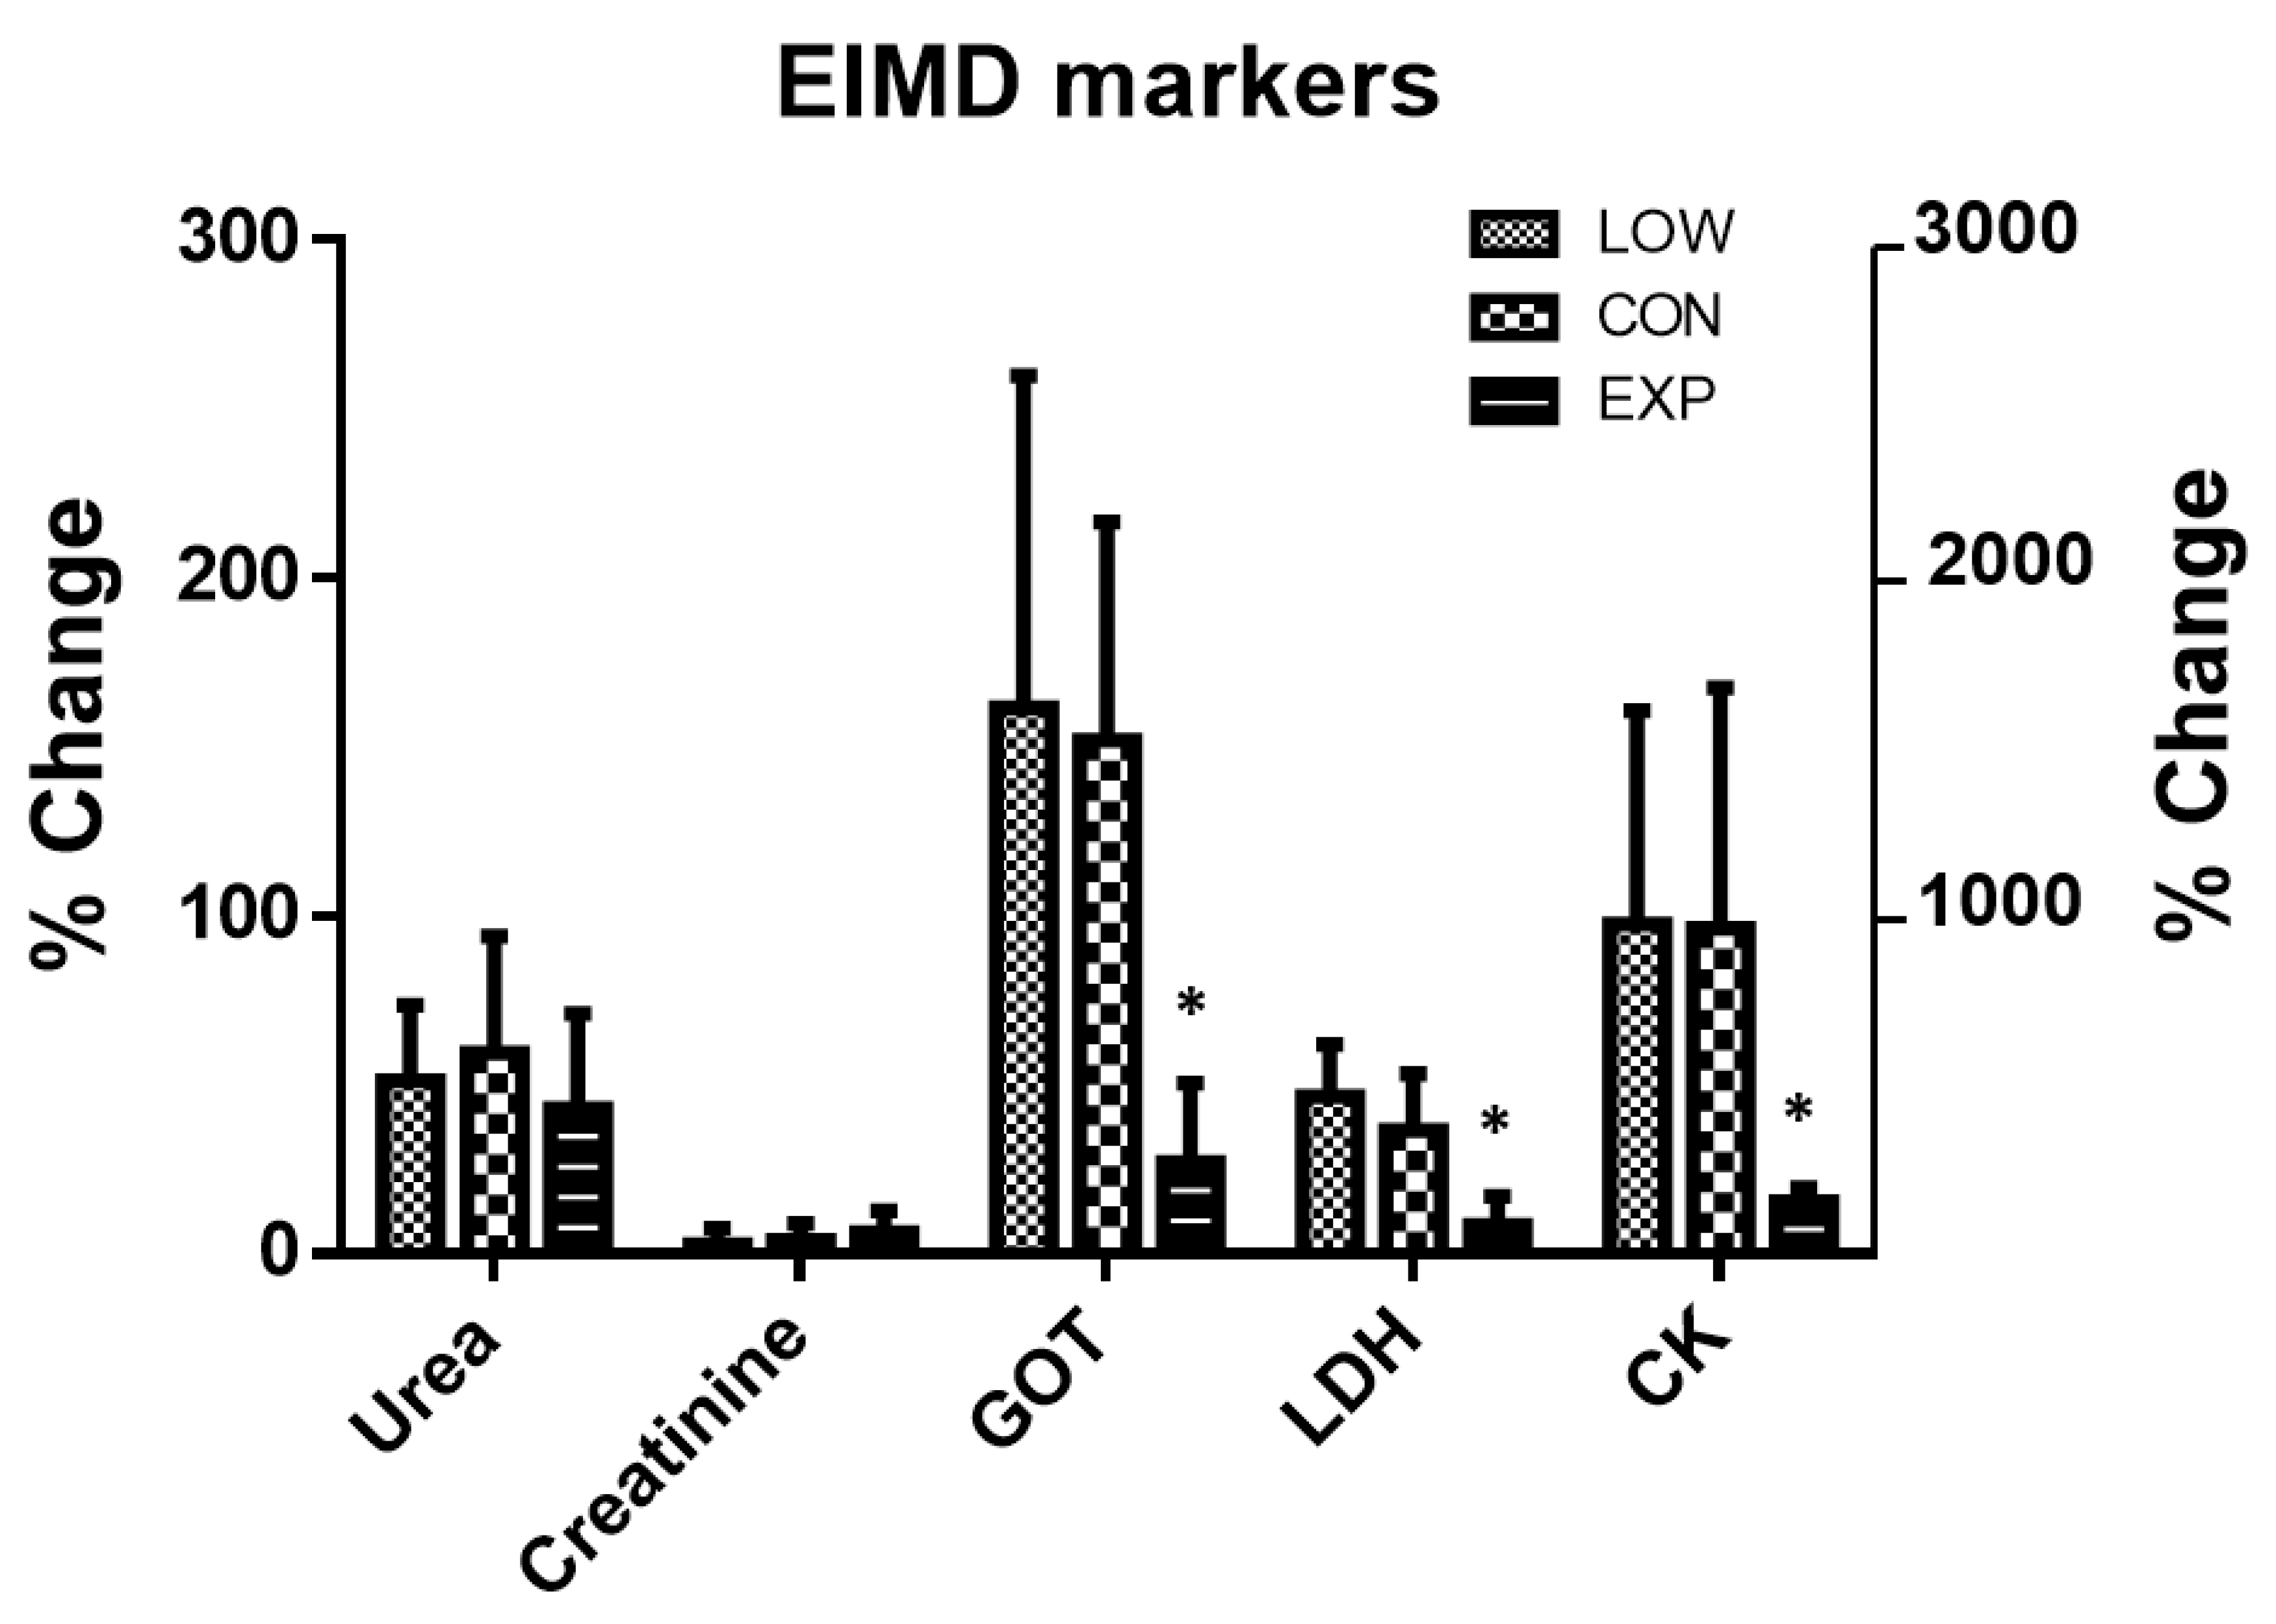
| Urea | ||||
| LOW | 28.8 ± 4.0 | 43.8 ± 10.3 * | 0.585 | 0.061 |
| CON | 28.4 ± 4.7 | 44.6 ± 7.2 * | ||
| EXP | 30.9 ± 7.1 | 42.9 ± 6.1 * | ||
| Creatinine | ||||
| LOW | 0.81 ± 0.08 | 0.83 ± 0.08 | 0.606 | 0.057 |
| CON | 0.87 ± 0.08 & | 0.91 ± 0.12 | ||
| EXP | 0.74 ± 0.08 | 0.79 ± 0.09 | ||
| GOT | ||||
| LOW | 26.8 ± 6.0 | 70.8 ± 36.1 *& | 0.027 | 0.363 |
| CON | 25.3 ± 6.6 | 63.0 ± 20.7 *& | ||
| EXP | 27.5 ± 5.6 | 36.5 ± 6.5 * | ||
| LDH | ||||
| LOW | 346.2 ± 66.4 | 504.0 ± 88.9 *& | <0.001 | 0.644 |
| CON | 359.1 ± 49.8 | 489.6 ± 78.3 *& | ||
| EXP | 381.9 ± 39.7 | 412.1 ± 29.6 | ||
| CK | ||||
| LOW | 137.2 ± 36.0 | 1528.8 ± 1099.7 *& | 0.032 | 0.332 |
| CON | 180.4 ± 99.7 | 1553.0 ± 867.0 *& | ||
| EXP | 192.9 ± 82.7 | 499.3 ± 245.8 * | ||
| LOW | CON | EXP | p | ŋ2p | |
|---|---|---|---|---|---|
| RPE | 16.2 ± 1.3 | 16.6 ± 1.6 | 15.4 ± 1.7 | 0.409 | 0.100 |
| Race time | 4:38:33 ± 0:43:13 | 4:44:27 ± 0:40:11 | 4:31:36 ± 0:41:345 | 0.871 | 0.018 |
| Race intensity (%) | 82.1 ± 4.6 | 84.9 ± 2.1 | 85.4 ± 3.8 | 0.290 | 0.162 |
| HRM | 159.0 ± 8.9 | 155.0 ± 9.5 | 156.9 ± 5.2 | 0.678 | 0.045 |
| HRmax | 180 ± 9.3 | 175.5 ± 7.4 | 182.4 ± 9.3 | 0.334 | 0.121 |
© 2020 by the authors. Licensee MDPI, Basel, Switzerland. This article is an open access article distributed under the terms and conditions of the Creative Commons Attribution (CC BY) license (http://creativecommons.org/licenses/by/4.0/).
Share and Cite
Viribay, A.; Arribalzaga, S.; Mielgo-Ayuso, J.; Castañeda-Babarro, A.; Seco-Calvo, J.; Urdampilleta, A. Effects of 120 g/h of Carbohydrates Intake during a Mountain Marathon on Exercise-Induced Muscle Damage in Elite Runners. Nutrients 2020, 12, 1367. https://doi.org/10.3390/nu12051367
Viribay A, Arribalzaga S, Mielgo-Ayuso J, Castañeda-Babarro A, Seco-Calvo J, Urdampilleta A. Effects of 120 g/h of Carbohydrates Intake during a Mountain Marathon on Exercise-Induced Muscle Damage in Elite Runners. Nutrients. 2020; 12(5):1367. https://doi.org/10.3390/nu12051367
Chicago/Turabian StyleViribay, Aitor, Soledad Arribalzaga, Juan Mielgo-Ayuso, Arkaitz Castañeda-Babarro, Jesús Seco-Calvo, and Aritz Urdampilleta. 2020. "Effects of 120 g/h of Carbohydrates Intake during a Mountain Marathon on Exercise-Induced Muscle Damage in Elite Runners" Nutrients 12, no. 5: 1367. https://doi.org/10.3390/nu12051367