Report on Government Services 2021
PART E, SECTION 12: RELEASED ON 28 JANUARY 2021
12 Public hospitals
This section is presented in a new online format. Dynamic data visualisations replace the static chapter format used in previous editions. Machine readable data are also available for download. A guide is available on accessing information in the new format.
Impact of COVID-19 on data for the Public hospitals section
COVID-19 may affect data in this Report in a number of ways. This includes in respect of actual performance (that is, the impact of COVID-19 on service delivery in 2020 which is reflected in the data results), and the collection and processing of data (that is, the ability of data providers to undertake data collection and process results for inclusion in the Report).
For the Public hospitals section, COVID-19 has had an impact on emergency department presentations and elective surgery data due to the temporary suspension of some elective surgeries in the first half of 2020.
This section reports on the performance of governments in providing public hospitals, with a focus on acute care services.
The Indicator Results tab uses data from the data tables to provide information on the performance for each indicator in the Indicator Framework. The same data are also available in CSV format.
- Context
- Indicator Framework
- Indicator Results
- Indigenous Data
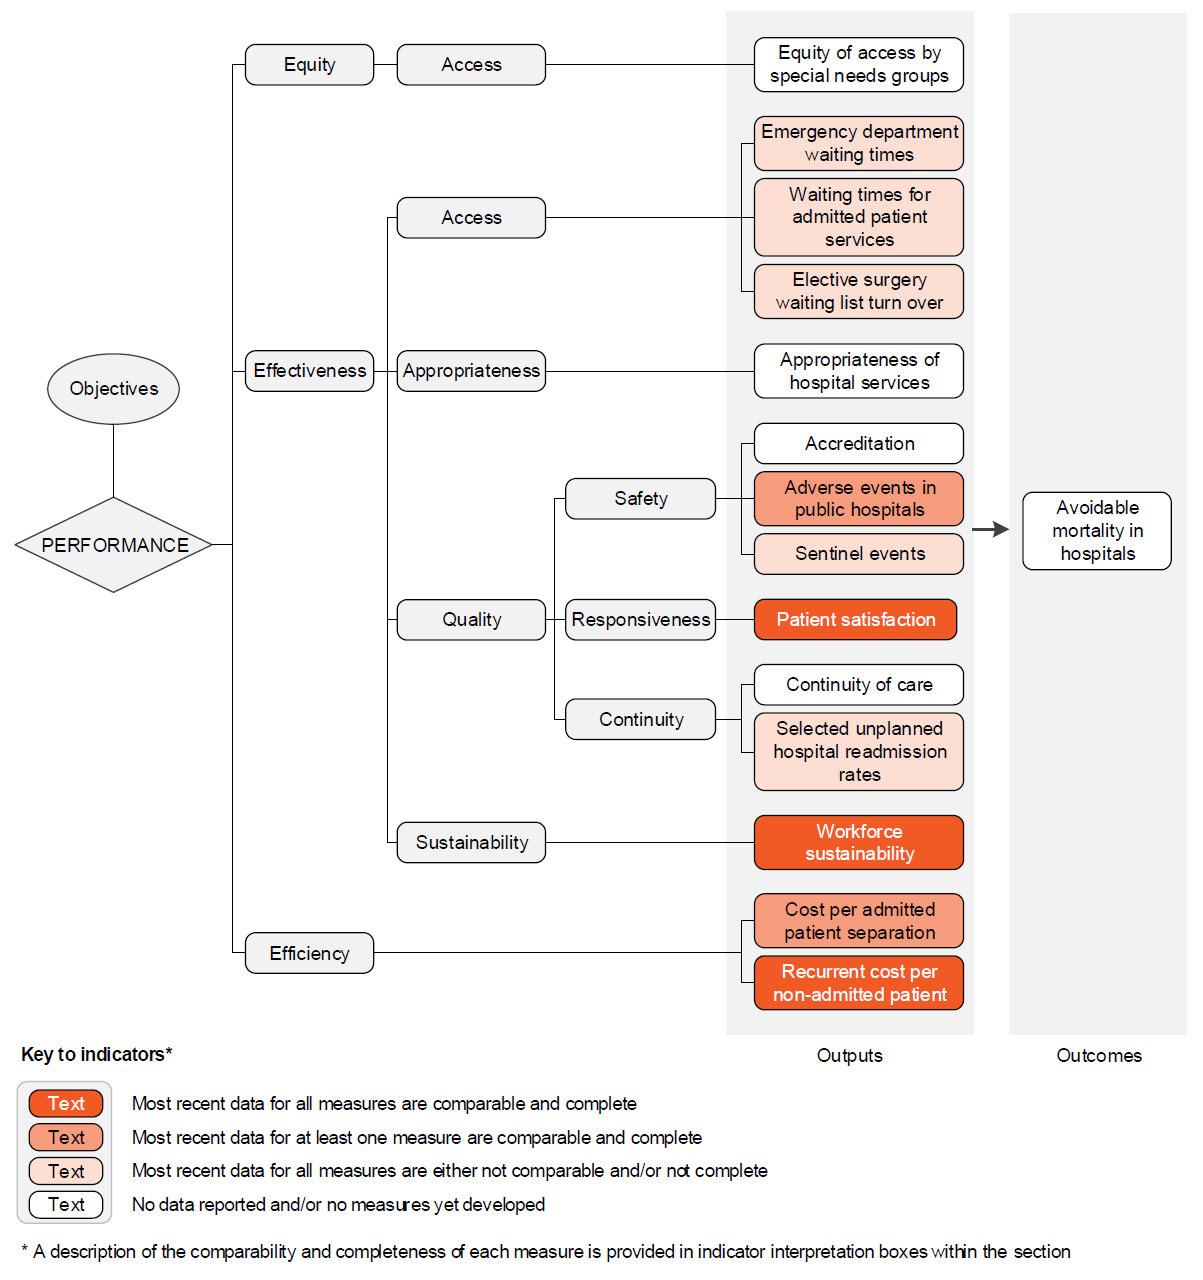
Objectives for public hospitals
Public hospitals aim to alleviate or manage illness and the effects of injury by providing acute, non and sub-acute care along with emergency and outpatient care that is:
- timely and accessible to all
- appropriate and responsive to the needs of individuals throughout their lifespan and communities
- high quality and safe
- well coordinated to ensure continuity of care where more than one service type, and/or ongoing service provision is required
- sustainable.
Governments aim for public hospital services to meet these objectives in an equitable and efficient manner.
Service overview
Public hospitals provide a range of services, including:
- acute care services to admitted patients
- subacute and non-acute services to admitted patients (for example, rehabilitation, palliative care and long stay maintenance care)
- emergency, outpatient and other services to non-admitted patients
- mental health services, including services provided to admitted patients by designated psychiatric/psychogeriatric units
- public health services
- teaching and research activities.
This section focuses on services (acute, subacute and non-acute) provided to admitted patients and services provided to non-admitted patients in public hospitals. These services comprise the bulk of public hospital activity.
In some instances, data for stand-alone psychiatric hospitals are included in this section. The performance of psychiatric hospitals and psychiatric units of public hospitals is examined more closely in the ‘Services for mental health’ section of this Report (section 13).
Funding
Total recurrent expenditure on public hospitals (excluding depreciation) was $72.2 billion in 2018‑19 (table 12A.1), with 92 per cent funded by the Australian, State and Territory governments and 8 per cent funded by non-government sources (including depreciation) (AIHW 2020b).
Government real recurrent expenditure (all sources) on public hospitals per person was $2851 in 2018‑19; an increase on 2017-18 ($2787, table 12A.2).
Size and scope
Hospitals
In 2018‑19, Australia had 692 public hospitals – 1 fewer than 2017‑18 (table 12A.3). Although 68.4 per cent of hospitals had 50 or fewer beds (figure 12.1), these smaller hospitals represented only 13.2 per cent of total available beds (table 12A.3).
Hospital beds
There were 63 048 available beds for admitted patients in public hospitals in 2018‑19, equivalent to 2.6 beds per 1000 people (tables 12A.3–4). The concept of an available bed is becoming less important in the overall context of hospital activity, particularly given the increasing significance of same day hospitalisations and hospital-in-the-home (AIHW 2011). Nationally, the number of beds available per 1000 people increased as remoteness increased (table 12A.4).
Admitted patient care
There were approximately 6.8 million separations from public (non-psychiatric) hospitals in 2018‑19, of which just over half were same day patients (table 12A.5). Nationally, this equates to 253.3 separations per 1000 people (figure 12.2). Acute care separations accounted for 93.9 per cent of separations from public hospitals (table 12A.10).
Variations in admission rates can reflect different practices in classifying patients as either admitted same day patients or non-admitted outpatients. The extent of differences in classification practices can be inferred from the variation in the proportion of same day separations across jurisdictions for certain conditions or treatments. This is particularly true of medical separations, where there was significant variation across jurisdictions in the proportion of same day medical separations in 2018-19 (table 12A.7).
In 2018-19, on an age-standardised basis, public hospital separation rates for Aboriginal and Torres Strait Islander people were markedly higher than the corresponding rates for all people. For private hospital separations, rates were higher for all people compared to Aboriginal and Torres Strait Islander people (though separations are lower for private hospitals compared to public hospitals) (table 12A.8).
Non-admitted patient services
Non-admitted patient services include outpatient services, which may be provided on an individual or group basis, and emergency department services. A total of 37.7 million individual service events were provided to outpatients in public hospitals in 2018-19 and around 1.3 million group service events (table 12A.11). Differing admission practices across states and territories lead to variation among jurisdictions in the services reported (AIHW 2020d). There were 8.2 million presentations to emergency departments in 2019‑20 (table 12A.12).
Staff
In 2018‑19, nurses comprised the single largest group of full time equivalent (FTE) staff employed in public hospitals (figure 12.3). Comparing data on FTE staff across jurisdictions should be undertaken with care, as these data are affected by jurisdictional differences in the recording and classification of staff.
References
Australian Commission on Safety and Quality in Health Care (ACSQHC) 2019, Annual Report 2018‑19 , ACSQHC, Sydney.
AIHW (Australian Institute of Health and Welfare) 2011, Australian Hospital Statistics 2009‑10 , Health Services Series No. 40, Cat. no. HSE 107 AIHW, Canberra.
—— 2020a, Elective surgery waiting times 2019‑20: Australian hospital statistics , AIHW, Canberra, https://www.aihw.gov.au/reports-data/myhospitals/sectors/elective-surgery (accessed 18 December 2020)
—— 2020b, Health expenditure Australia 2018-19 , Health and Welfare Expenditure Series No. 66, Cat. no. HWE 80 AIHW, Canberra.
—— 2020c, Hospital resources 2018‑19: Australian hospital statistics , Health services series, AIHW, Canberra, https://www.aihw.gov.au/reports/hospitals/hospital-resources-2017-18-ahs/data (accessed 9 October 2020).
—— 2020d, Non-admitted patient care 2018‑19: Australian hospital statistics , Health services series, AIHW, Canberra, https://www.aihw.gov.au/reports/hospitals/non-admitted-patient-care-2017-18-ahs/contents/at-a-glance (accessed 9 October 2020).
The performance indicator framework provides information on equity, efficiency and effectiveness, and distinguishes the outputs and outcomes of public hospital services.
The performance indicator framework shows which data are complete and comparable in this Report. For data that are not considered directly comparable, text includes relevant caveats and supporting commentary. Section 1 discusses data comparability and completeness from a Report-wide perspective. In addition to the service area's Profile information, the Report’s statistical context (section 2) contains data that may assist in interpreting the performance indicators presented in this section.
Improvements to performance reporting for public hospital services are ongoing and include identifying data sources to fill gaps in reporting for performance indicators and measures, and improving the comparability and completeness of data.
Outputs
Outputs are the services delivered (while outcomes are the impact of these services on the status of an individual or group) (see section 1). Output information is also critical for equitable, efficient and effective management of government services.
Outcomes
Outcomes are the impact of services on the status of an individual or group (see section 1).
An overview of the public hospital services performance indicator results are presented. Different delivery contexts, locations and types of clients can affect the equity, effectiveness and efficiency of public hospital services.
Information to assist the interpretation of these data can be found in the public hospital services supporting interpretative material and data tables. Data tables are identified by a ‘12A’ prefix (for example, table 12A.1).
All data are available for download as an excel spreadsheet and as a CSV dataset — refer to Download supporting material. Specific data used in figures can be downloaded by clicking in the figure area, navigating to the bottom of the visualisation to the grey toolbar, clicking on the 'Download' icon and selecting 'Data' from the menu. Selecting 'PDF' or 'Powerpoint' from the 'Download' menu will download a static view of the performance indicator results.
Performance indicator data for Aboriginal and Torres Strait Islander people in this section are available in the data tables listed below. Contextual data and further supporting information can be found in the section.
| Table number | Table title |
|---|---|
| Table 12A.15 | Patients treated within national benchmarks for emergency department waiting time, by Indigenous status, by State and Territory |
| Table 12A.20 | Waiting times for elective surgery in public hospitals, by Indigenous status and procedure, by State and Territory (days) |
| Table 12A.37 | Separations for falls resulting in patient harm in hospitals, per 1000 separations |
| Table 12A.53 | Unplanned hospital readmission rates, by Indigenous status, hospital peer group, remoteness and SEIFA IRSD quintiles |
Download supporting material
- 12 Public hospitals interpretative material (PDF - 254 Kb)
- 12 Public hospitals interpretative material (Word - 98 Kb)
- 12 Public hospitals data tables (XLSX - 849 Kb)
- 12 Public hospitals dataset (CSV - 2102 Kb)
See the interpretative material and corresponding table number in the data tables for detailed definitions, caveats, footnotes and data source(s).