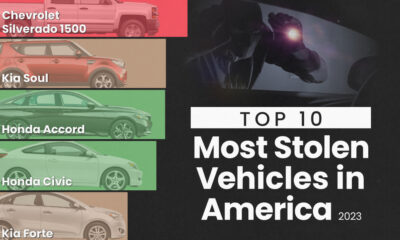
In this infographic, we list the most stolen vehicles in the U.S. in 2023, according to the National Insurance Crime...


click for more →


Scan with your phone's camera or QR code app to view
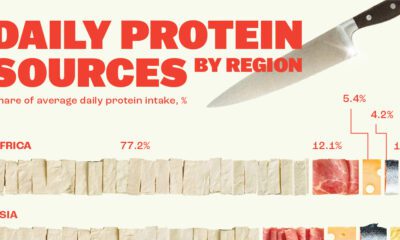

Here, we break down how people around the world get their protein intake.
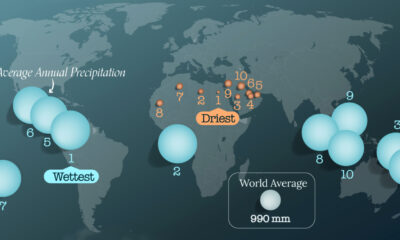

From tropical rainforests to the sandy deserts of North Africa, the world’s wettest and driest countries are a study in contrasts.


Three countries account for almost 90% of the lithium produced in the world.
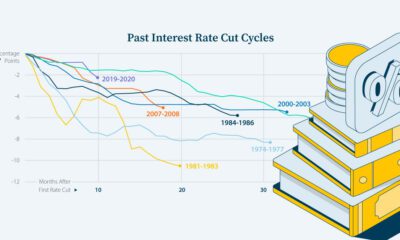

How have previous cycles of interest rate cuts in the U.S. impacted the economy and financial markets?

Families in expensive states require over $270,000 annually to live comfortably.
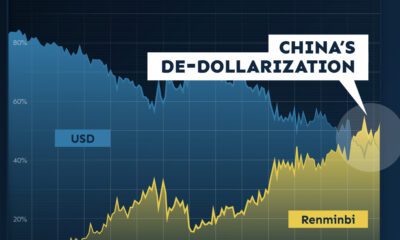

The de-dollarization of China’s trade settlements has begun. What patterns do we see in USD and RMB use within China and globally?
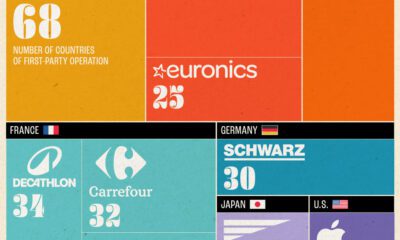
From fast-fashion giant H&M to Apple, we show the top retailers globally with the largest international presence.
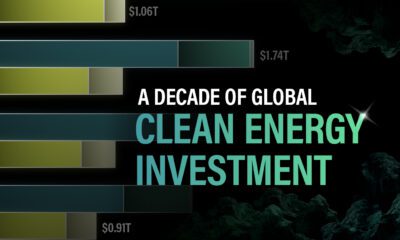

In this graphic, Visual Capitalist has partnered with EnergyX to explore the growth of global clean energy investment.
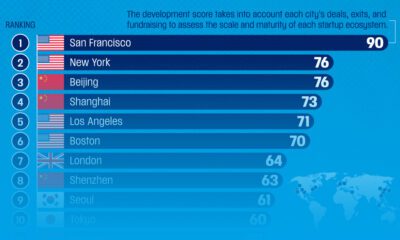
Here are the global startup ecosystem rankings, highlighting the scale and maturity of major tech hubs worldwide.

Ten Indian states—most of them from the northeast region of the country—don’t have a single city with 1 million residents.